Os08g0452500
blastp(Os)/ blastp(At)/ coex/// RAP/ RiceXPro/ SALAD/ ATTED-II
Description : Auxin responsive SAUR protein family protein.


FiT-DB / Search/ Help/ Sample detail
|
Os08g0452500 |
blastp(Os)/ blastp(At)/ coex/// RAP/ RiceXPro/ SALAD/ ATTED-II |
|
Description : Auxin responsive SAUR protein family protein.
|
|
log2(Expression) ~ Norm(μ, σ2)
μ = α + β1D + β2C + β3E + β4D*C + β5D*E + γ1N8
|
_____ |
|

 __
__
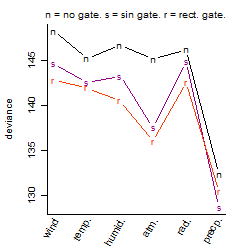
Dependence on each variable

Residual plot

Process of the parameter reduction
(fixed parameters. wheather = precipitation,
response mode = > th, dose dependency = dose dependent, type of G = no)
| deviance | σ | α | β1 | β2 | β3 | β4 | β5 | γ1 | peak time of C | threshold | memory length | peak or start time of G | open length of G |
|---|---|---|---|---|---|---|---|---|---|---|---|---|---|
| 131.51 | 0.539 | 3.71 | -0.885 | 0.421 | 19.2 | -1.06 | -64.3 | -0.0508 | 9.88 | 0.1127 | 77 | -- | -- |
| 139.99 | 0.551 | 3.6 | -0.424 | 0.392 | 4.08 | -2.09 | -- | -0.00742 | 8.51 | 1.782 | 127 | -- | -- |
| 134.87 | 0.541 | 3.72 | -0.92 | 0.438 | 19.7 | -- | -65.9 | -0.0478 | 11 | 0.2058 | 77 | -- | -- |
| 139.83 | 0.551 | 3.61 | -0.624 | 0.441 | 3.77 | -- | -- | -0.0819 | 11.2 | 1.615 | 90 | -- | -- |
| 146.7 | 0.564 | 3.73 | -0.932 | -- | 19.6 | -- | -66.1 | -0.0431 | -- | 0.1523 | 77 | -- | -- |
| 152.61 | 0.579 | 3.61 | -0.493 | 0.408 | -- | -1.26 | -- | -0.0816 | 9.55 | -- | -- | -- | -- |
| 156.73 | 0.586 | 3.61 | -0.533 | 0.435 | -- | -- | -- | -0.0787 | 11.2 | -- | -- | -- | -- |
| 152.37 | 0.575 | 3.62 | -0.585 | -- | 3.69 | -- | -- | -0.0729 | -- | 1.5 | 67 | -- | -- |
| 148.22 | 0.567 | 3.59 | -- | 0.462 | 3.69 | -- | -- | -0.00669 | 10.8 | 1.5 | 100 | -- | -- |
| 168.57 | 0.607 | 3.62 | -0.543 | -- | -- | -- | -- | -0.0825 | -- | -- | -- | -- | -- |
| 164.21 | 0.599 | 3.6 | -- | 0.441 | -- | -- | -- | -0.0194 | 11.2 | -- | -- | -- | -- |
| 161.39 | 0.592 | 3.6 | -- | -- | 3.54 | -- | -- | -0.00738 | -- | 1.5 | 100 | -- | -- |
| 176.35 | 0.62 | 3.61 | -- | -- | -- | -- | -- | -0.0222 | -- | -- | -- | -- | -- |
Results of the grid search
Summarized heatmap of deviance
|
Histogram 
|
Local optima within top1000 grid-points
| rank | deviance | wheather | threshold | memory length | response mode | dose dependency | type of G | peak or start time of G | open length of G |
|---|---|---|---|---|---|---|---|---|---|
| 1 | 128.64 | precipitation | 0.1 | 10 | < th | dose independent | sin | 18 | NA |
| 2 | 128.64 | precipitation | 0.1 | 10 | < th | dose dependent | sin | 18 | NA |
| 5 | 130.38 | precipitation | 0.1 | 90 | > th | dose dependent | rect. | 1 | 18 |
| 15 | 131.14 | precipitation | 0.1 | 10 | > th | dose independent | sin | 18 | NA |
| 25 | 131.37 | precipitation | 0.1 | 90 | > th | dose dependent | rect. | 7 | 21 |
| 31 | 131.52 | precipitation | 0.1 | 90 | > th | dose dependent | rect. | 3 | 16 |
| 35 | 131.61 | precipitation | 0.1 | 90 | > th | dose dependent | rect. | 10 | 18 |
| 39 | 131.69 | precipitation | 0.1 | 10 | > th | dose dependent | sin | 19 | NA |
| 51 | 132.12 | precipitation | 0.1 | 90 | < th | dose independent | sin | 22 | NA |
| 52 | 132.12 | precipitation | 0.1 | 90 | < th | dose dependent | sin | 22 | NA |
| 53 | 132.15 | precipitation | 0.1 | 90 | > th | dose dependent | rect. | 14 | 14 |
| 61 | 132.32 | precipitation | 0.1 | 90 | > th | dose dependent | no | NA | NA |
| 62 | 132.32 | precipitation | 0.1 | 90 | > th | dose dependent | rect. | 10 | 22 |
| 63 | 132.32 | precipitation | 0.1 | 90 | > th | dose dependent | rect. | 13 | 22 |
| 65 | 132.32 | precipitation | 0.1 | 90 | > th | dose dependent | rect. | 3 | 23 |
| 97 | 132.63 | precipitation | 0.1 | 90 | > th | dose independent | rect. | 1 | 18 |
| 105 | 132.73 | precipitation | 0.1 | 90 | > th | dose dependent | sin | 1 | NA |
| 108 | 132.91 | precipitation | 0.1 | 90 | > th | dose dependent | rect. | 13 | 19 |
| 150 | 133.29 | precipitation | 0.1 | 90 | < th | dose independent | sin | 0 | NA |
| 151 | 133.29 | precipitation | 0.1 | 90 | < th | dose dependent | sin | 0 | NA |
| 165 | 133.56 | precipitation | 0.1 | 90 | > th | dose dependent | rect. | 7 | 12 |
| 170 | 133.59 | precipitation | 0.1 | 90 | > th | dose independent | rect. | 7 | 21 |
| 175 | 133.73 | precipitation | 0.1 | 90 | > th | dose dependent | rect. | 10 | 9 |
| 180 | 133.85 | precipitation | 0.1 | 90 | > th | dose independent | rect. | 10 | 18 |
| 188 | 134.18 | precipitation | 0.1 | 90 | > th | dose independent | rect. | 3 | 16 |
| 193 | 134.22 | precipitation | 0.1 | 90 | < th | dose independent | sin | 19 | NA |
| 195 | 134.22 | precipitation | 0.1 | 90 | < th | dose dependent | sin | 19 | NA |
| 196 | 134.24 | precipitation | 0.1 | 90 | > th | dose dependent | rect. | 13 | 6 |
| 202 | 134.33 | precipitation | 0.1 | 90 | > th | dose independent | rect. | 7 | 12 |
| 203 | 134.33 | precipitation | 0.1 | 90 | > th | dose independent | rect. | 13 | 15 |
| 219 | 134.50 | precipitation | 0.1 | 90 | > th | dose independent | rect. | 15 | 4 |
| 225 | 134.56 | precipitation | 0.1 | 90 | > th | dose independent | rect. | 10 | 9 |
| 237 | 134.64 | precipitation | 0.1 | 90 | > th | dose dependent | sin | 15 | NA |
| 256 | 134.76 | precipitation | 0.1 | 90 | > th | dose independent | rect. | 17 | 2 |
| 276 | 134.90 | precipitation | 0.1 | 10 | < th | dose independent | sin | 22 | NA |
| 278 | 134.90 | precipitation | 0.1 | 10 | < th | dose dependent | sin | 22 | NA |
| 289 | 135.06 | precipitation | 0.1 | 10 | > th | dose independent | rect. | 17 | 3 |
| 309 | 135.06 | precipitation | 0.1 | 10 | > th | dose dependent | rect. | 17 | 3 |
| 468 | 135.35 | precipitation | 0.1 | 10 | > th | dose independent | rect. | 17 | 1 |
| 497 | 135.35 | precipitation | 0.1 | 10 | > th | dose dependent | rect. | 17 | 1 |
| 531 | 135.39 | precipitation | 0.1 | 90 | > th | dose independent | sin | 23 | NA |
| 572 | 135.64 | precipitation | 0.1 | 90 | > th | dose independent | no | NA | NA |
| 573 | 135.64 | precipitation | 0.1 | 90 | < th | dose independent | no | NA | NA |
| 574 | 135.64 | precipitation | 0.1 | 90 | > th | dose independent | rect. | 10 | 22 |
| 575 | 135.64 | precipitation | 0.1 | 90 | > th | dose independent | rect. | 13 | 22 |
| 576 | 135.64 | precipitation | 0.1 | 90 | > th | dose independent | rect. | 3 | 23 |
| 581 | 135.64 | precipitation | 0.1 | 90 | < th | dose dependent | no | NA | NA |
| 590 | 135.73 | precipitation | 0.1 | 90 | > th | dose independent | rect. | 15 | 23 |
| 611 | 135.97 | atmosphere | 1000.0 | 90 | < th | dose independent | rect. | 16 | 1 |
| 636 | 136.24 | precipitation | 0.1 | 90 | > th | dose independent | rect. | 13 | 19 |
| 682 | 136.63 | atmosphere | 1005.0 | 90 | > th | dose independent | rect. | 15 | 15 |
| 766 | 137.17 | precipitation | 0.1 | 90 | < th | dose independent | sin | 16 | NA |
| 767 | 137.17 | precipitation | 0.1 | 90 | < th | dose dependent | sin | 16 | NA |
| 820 | 137.53 | atmosphere | 1005.0 | 90 | > th | dose independent | sin | 15 | NA |
| 826 | 137.64 | atmosphere | 1000.0 | 90 | < th | dose dependent | rect. | 16 | 1 |
| 854 | 138.13 | precipitation | 0.1 | 90 | < th | dose independent | sin | 13 | NA |
| 856 | 138.13 | precipitation | 0.1 | 90 | < th | dose dependent | sin | 13 | NA |