Os01g0899800
blastp(Os)/ blastp(At)/ coex/// RAP/ RiceXPro/ SALAD/ ATTED-II
Description : Pathogenesis-related transcriptional factor and ERF domain containing protein.


FiT-DB / Search/ Help/ Sample detail
|
Os01g0899800 |
blastp(Os)/ blastp(At)/ coex/// RAP/ RiceXPro/ SALAD/ ATTED-II |
|
Description : Pathogenesis-related transcriptional factor and ERF domain containing protein.
|
|
log2(Expression) ~ Norm(μ, σ2)
μ = α + β1D + β2C + β3E + β4D*C + β5D*E + γ1N8
|
_____ |
|
 __
__
Dependence on each variable

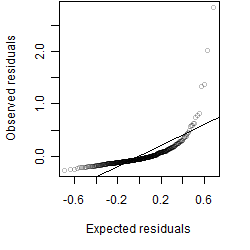
Residual plot

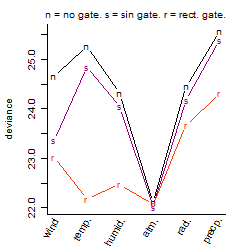
Process of the parameter reduction
(fixed parameters. wheather = atmosphere,
response mode = > th, dose dependency = dose independent, type of G = no)
| deviance | σ | α | β1 | β2 | β3 | β4 | β5 | γ1 | peak time of C | threshold | memory length | peak or start time of G | open length of G |
|---|---|---|---|---|---|---|---|---|---|---|---|---|---|
| 22.1 | 0.219 | 3.01 | 0.0138 | 0.124 | 0.703 | 0.149 | -1.88 | -0.00463 | 10.6 | 1015 | 10 | -- | -- |
| 23.94 | 0.23 | 3.01 | -0.0145 | 0.123 | 0.663 | 0.285 | -- | -0.00923 | 11 | 1015 | 10 | -- | -- |
| 22.18 | 0.221 | 3.01 | 0.0204 | 0.125 | 0.701 | -- | -1.96 | -0.00432 | 10.3 | 1015 | 15 | -- | -- |
| 24.26 | 0.231 | 3.01 | -0.00367 | 0.124 | 0.657 | -- | -- | -0.0089 | 10.3 | 1015 | 25 | -- | -- |
| 23.11 | 0.225 | 3.01 | 0.0184 | -- | 0.641 | -- | -1.96 | -0.00534 | -- | 1015 | 15 | -- | -- |
| 25.65 | 0.237 | 3.01 | -0.0149 | 0.102 | -- | 0.277 | -- | -0.0168 | 10.9 | -- | -- | -- | -- |
| 25.94 | 0.239 | 3.01 | -0.00462 | 0.105 | -- | -- | -- | -0.0166 | 9.95 | -- | -- | -- | -- |
| 24.86 | 0.232 | 3.01 | -0.00623 | -- | 0.659 | -- | -- | -0.00311 | -- | 1014 | 18 | -- | -- |
| 24.26 | 0.231 | 3.01 | -- | 0.124 | 0.657 | -- | -- | -0.00849 | 10.3 | 1015 | 45 | -- | -- |
| 26.6 | 0.241 | 3.02 | -0.00585 | -- | -- | -- | -- | -0.0166 | -- | -- | -- | -- | -- |
| 25.94 | 0.238 | 3.01 | -- | 0.105 | -- | -- | -- | -0.0161 | 9.95 | -- | -- | -- | -- |
| 24.83 | 0.232 | 3.01 | -- | -- | 0.601 | -- | -- | -0.00632 | -- | 1014 | 25 | -- | -- |
| 26.6 | 0.241 | 3.02 | -- | -- | -- | -- | -- | -0.016 | -- | -- | -- | -- | -- |
Results of the grid search
Summarized heatmap of deviance
|
Histogram 
|
Local optima within top1000 grid-points
| rank | deviance | wheather | threshold | memory length | response mode | dose dependency | type of G | peak or start time of G | open length of G |
|---|---|---|---|---|---|---|---|---|---|
| 1 | 22.01 | atmosphere | 1015 | 30 | < th | dose independent | sin | 13 | NA |
| 3 | 22.01 | atmosphere | 1015 | 270 | < th | dose independent | sin | 15 | NA |
| 4 | 22.01 | atmosphere | 1015 | 30 | < th | dose independent | sin | 0 | NA |
| 19 | 22.06 | atmosphere | 1015 | 720 | > th | dose independent | sin | 22 | NA |
| 22 | 22.06 | atmosphere | 1015 | 720 | > th | dose dependent | rect. | 3 | 20 |
| 27 | 22.07 | atmosphere | 1015 | 720 | > th | dose dependent | sin | 22 | NA |
| 33 | 22.10 | atmosphere | 1015 | 10 | > th | dose independent | sin | 7 | NA |
| 129 | 22.10 | atmosphere | 1015 | 10 | > th | dose independent | no | NA | NA |
| 135 | 22.10 | atmosphere | 1015 | 10 | < th | dose independent | no | NA | NA |
| 139 | 22.10 | atmosphere | 1015 | 270 | > th | dose independent | rect. | 20 | 1 |
| 146 | 22.10 | atmosphere | 1015 | 10 | > th | dose independent | rect. | 23 | 1 |