Os12g0456700
blastp(Os)/ blastp(At)/ coex/// RAP/ RiceXPro/ SALAD/ ATTED-II
Description : Glycerophosphoryl diester phosphodiesterase family protein.

FiT-DB / Search/ Help/ Sample detail
|
Os12g0456700 |
blastp(Os)/ blastp(At)/ coex/// RAP/ RiceXPro/ SALAD/ ATTED-II |
|
Description : Glycerophosphoryl diester phosphodiesterase family protein.
|
|
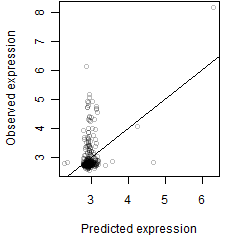
log2(Expression) ~ Norm(μ, σ2)
μ = α + β1D + β2C + β3E + β4D*C + β5D*E + γ1N8
|
_____ |
|
 __
__

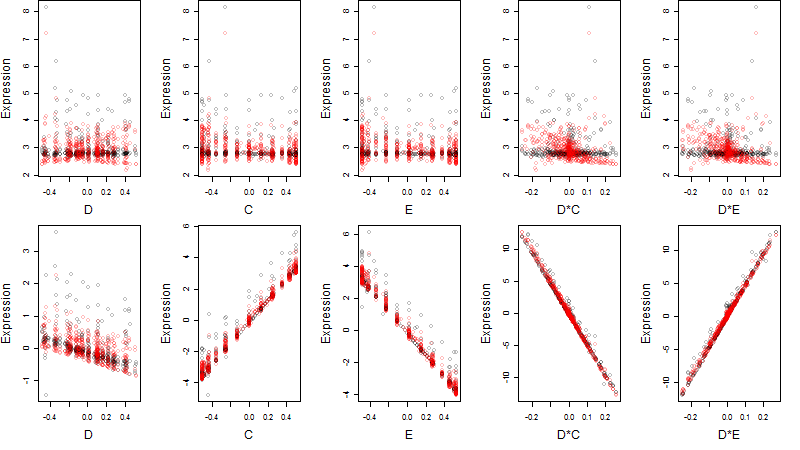
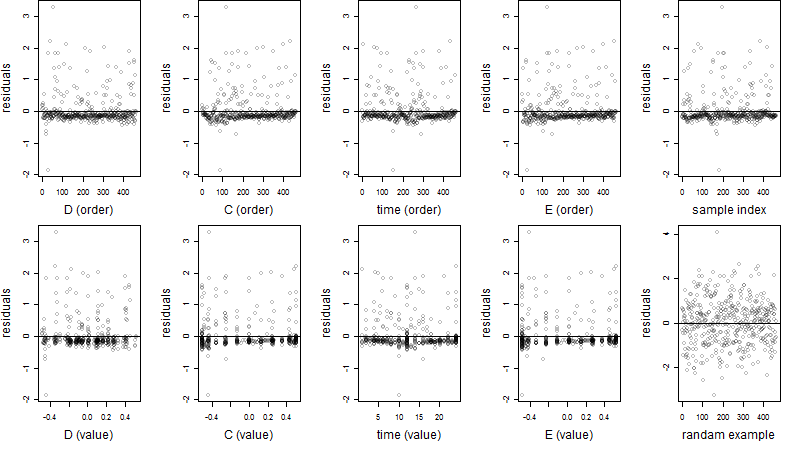
Dependence on each variable
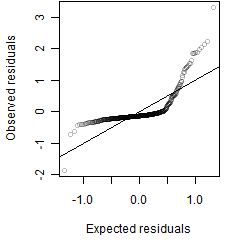
Residual plot
Process of the parameter reduction
(fixed parameters. wheather = radiation,
response mode = < th, dose dependency = dose independent, type of G = sin)
| deviance | σ | α | β1 | β2 | β3 | β4 | β5 | γ1 | peak time of C | threshold | memory length | peak or start time of G | open length of G |
|---|---|---|---|---|---|---|---|---|---|---|---|---|---|
| 98.8 | 0.467 | 3.07 | -0.898 | 6.84 | -6.94 | -47.9 | 47.3 | 0.0192 | 0.00252 | 39.13 | 9 | 6.07 | -- |
| 120.11 | 0.514 | 2.82 | -0.078 | 11.6 | 11.6 | -0.374 | -- | -0.00654 | 4.23 | 812.5 | 5 | 13.8 | -- |
| 120.11 | 0.51 | 2.93 | -0.0805 | 1.76 | 1.75 | -- | 0.376 | -0.00405 | 4.69 | 642.9 | 47520 | 13.6 | -- |
| 120.5 | 0.511 | 2.83 | -0.0738 | 11.8 | 11.8 | -- | -- | -0.00347 | 4.13 | 852.6 | 3 | 13.9 | -- |
| 120.38 | 0.511 | 2.95 | -0.0758 | -- | 0.146 | -- | 0.185 | -0.00339 | -- | 654 | 47520 | 19.1 | -- |
| 120.38 | 0.514 | 2.95 | -0.0806 | 0.146 | -- | 0.186 | -- | -0.00364 | 10.9 | -- | -- | -- | -- |
| 120.5 | 0.514 | 2.95 | -0.0738 | 0.147 | -- | -- | -- | -0.00355 | 10.4 | -- | -- | -- | -- |
| 120.5 | 0.511 | 2.95 | -0.0736 | -- | 0.147 | -- | -- | -0.00362 | -- | 690.8 | 47520 | 19.6 | -- |
| 120.65 | 0.512 | 2.83 | -- | 12 | 12 | -- | -- | 0.00464 | 4.08 | 891.2 | 3 | 14 | -- |
| 121.83 | 0.516 | 2.95 | -0.0761 | -- | -- | -- | -- | -0.00401 | -- | -- | -- | -- | -- |
| 120.65 | 0.514 | 2.95 | -- | 0.148 | -- | -- | -- | 0.00467 | 10.4 | -- | -- | -- | -- |
| 120.65 | 0.512 | 2.95 | -- | -- | 0.147 | -- | -- | 0.00469 | -- | 718.8 | 47520 | 19.6 | -- |
| 121.98 | 0.516 | 2.95 | -- | -- | -- | -- | -- | 0.00444 | -- | -- | -- | -- | -- |
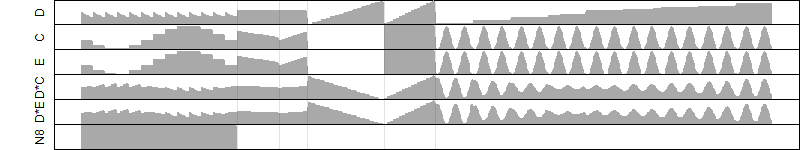
Results of the grid search
Summarized heatmap of deviance
|
Histogram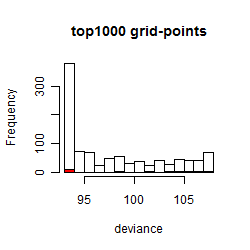 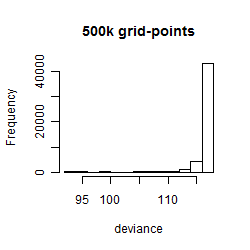
|
Local optima within top1000 grid-points
| rank | deviance | wheather | threshold | memory length | response mode | dose dependency | type of G | peak or start time of G | open length of G |
|---|---|---|---|---|---|---|---|---|---|
| 1 | 93.09 | humidity | 70 | 10 | < th | dose independent | rect. | 18 | 14 |
| 5 | 93.11 | humidity | 70 | 90 | < th | dose dependent | rect. | 18 | 14 |
| 6 | 93.11 | humidity | 70 | 10 | < th | dose dependent | rect. | 17 | 16 |
| 8 | 93.16 | humidity | 80 | 90 | < th | dose dependent | rect. | 22 | 9 |
| 12 | 93.19 | radiation | 30 | 10 | > th | dose independent | rect. | 7 | 1 |
| 36 | 93.25 | radiation | 30 | 90 | > th | dose independent | rect. | 7 | 1 |
| 72 | 93.27 | humidity | 80 | 90 | < th | dose dependent | rect. | 6 | 1 |
| 73 | 93.27 | radiation | 30 | 10 | > th | dose dependent | rect. | 7 | 1 |
| 89 | 93.28 | humidity | 80 | 90 | < th | dose independent | rect. | 6 | 1 |
| 152 | 93.33 | humidity | 70 | 10 | < th | dose independent | rect. | 7 | 1 |
| 212 | 93.33 | humidity | 70 | 10 | < th | dose dependent | rect. | 7 | 1 |
| 642 | 98.55 | atmosphere | 1005 | 30 | > th | dose dependent | rect. | 7 | 1 |
| 737 | 101.72 | radiation | 40 | 10 | < th | dose independent | sin | 12 | NA |
| 793 | 103.33 | humidity | 70 | 10 | < th | dose independent | sin | 11 | NA |
| 828 | 104.50 | humidity | 70 | 10 | > th | dose independent | sin | 11 | NA |
| 880 | 105.77 | radiation | 30 | 10 | > th | dose independent | sin | 12 | NA |
| 892 | 106.10 | radiation | 20 | 10 | > th | dose dependent | sin | 12 | NA |
| 913 | 106.36 | humidity | 80 | 1440 | < th | dose dependent | rect. | 22 | 9 |
| 917 | 106.47 | humidity | 70 | 1440 | > th | dose independent | rect. | 21 | 10 |
| 929 | 106.98 | humidity | 70 | 4320 | < th | dose dependent | rect. | 7 | 1 |
| 951 | 107.34 | humidity | 70 | 1440 | > th | dose independent | rect. | 24 | 7 |
| 952 | 107.36 | humidity | 80 | 720 | < th | dose dependent | rect. | 6 | 1 |