Os11g0540100
blastp(Os)/ blastp(At)/ coex/// RAP/ RiceXPro/ SALAD/ ATTED-II
Description : Similar to Xaa-Pro aminopeptidase 2 (EC 3.4.11.9).


FiT-DB / Search/ Help/ Sample detail
|
Os11g0540100 |
blastp(Os)/ blastp(At)/ coex/// RAP/ RiceXPro/ SALAD/ ATTED-II |
|
Description : Similar to Xaa-Pro aminopeptidase 2 (EC 3.4.11.9).
|
|
log2(Expression) ~ Norm(μ, σ2)
μ = α + β1D + β2C + β3E + β4D*C + β5D*E + γ1N8
|
_____ |
|
 __
__

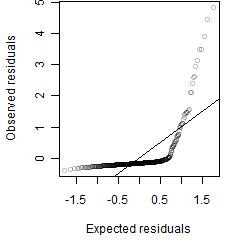
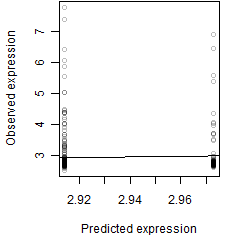
Dependence on each variable

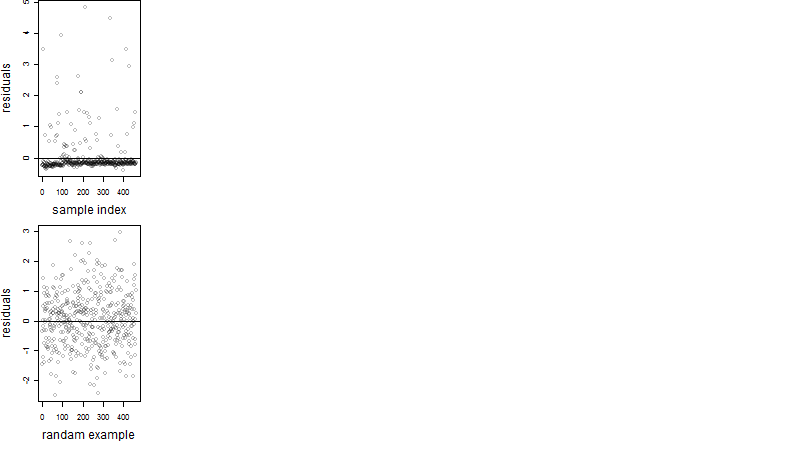
Residual plot
Process of the parameter reduction
(fixed parameters. wheather = wind,
response mode = > th, dose dependency = dose dependent, type of G = no)
| deviance | σ | α | β1 | β2 | β3 | β4 | β5 | γ1 | peak time of C | threshold | memory length | peak or start time of G | open length of G |
|---|---|---|---|---|---|---|---|---|---|---|---|---|---|
| 166.74 | 0.607 | 2.9 | -0.0846 | 0.0833 | 0.657 | -1.11 | -3.57 | 0.0745 | 6.11 | 10.38 | 619 | -- | -- |
| 167.03 | 0.602 | 2.91 | -0.0515 | 0.0844 | 1.39 | -1.08 | -- | 0.0755 | 6.15 | 10.4 | 618 | -- | -- |
| 169.6 | 0.607 | 2.9 | -0.1 | 0.0813 | 0.438 | -- | -4.09 | 0.076 | 4.79 | 10.3 | 620 | -- | -- |
| 169.86 | 0.607 | 2.91 | -0.0668 | 0.0745 | 1.25 | -- | -- | 0.0783 | 4.94 | 10.39 | 628 | -- | -- |
| 169.94 | 0.607 | 2.9 | -0.0929 | -- | 0.561 | -- | -3.3 | 0.0801 | -- | 10.3 | 628 | -- | -- |
| 174.4 | 0.619 | 2.92 | -0.132 | 0.0408 | -- | -0.875 | -- | 0.039 | 5.75 | -- | -- | -- | -- |
| 176.07 | 0.621 | 2.92 | -0.139 | 0.0672 | -- | -- | -- | 0.0419 | 1.84 | -- | -- | -- | -- |
| 170.18 | 0.608 | 2.91 | -0.0619 | -- | 1.25 | -- | -- | 0.0757 | -- | 10.36 | 627 | -- | -- |
| 169.95 | 0.607 | 2.91 | -- | 0.0786 | 1.29 | -- | -- | 0.0819 | 4.46 | 10.37 | 628 | -- | -- |
| 176.35 | 0.621 | 2.92 | -0.136 | -- | -- | -- | -- | 0.0435 | -- | -- | -- | -- | -- |
| 176.58 | 0.622 | 2.92 | -- | 0.0647 | -- | -- | -- | 0.0573 | 1.78 | -- | -- | -- | -- |
| 170.28 | 0.608 | 2.91 | -- | -- | 1.27 | -- | -- | 0.0831 | -- | 10.35 | 626 | -- | -- |
| 176.83 | 0.621 | 2.91 | -- | -- | -- | -- | -- | 0.0585 | -- | -- | -- | -- | -- |
Results of the grid search
Summarized heatmap of deviance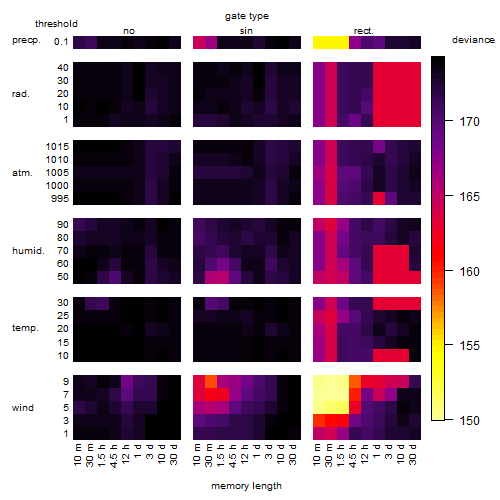
|
Histogram 
|
Local optima within top1000 grid-points
| rank | deviance | wheather | threshold | memory length | response mode | dose dependency | type of G | peak or start time of G | open length of G |
|---|---|---|---|---|---|---|---|---|---|
| 1 | 149.91 | wind | 9.0 | 30 | > th | dose dependent | rect. | 19 | 7 |
| 10 | 149.92 | wind | 7.0 | 10 | > th | dose independent | rect. | 20 | 7 |
| 17 | 150.22 | wind | 7.0 | 90 | > th | dose independent | rect. | 20 | 1 |
| 23 | 150.29 | wind | 9.0 | 30 | > th | dose dependent | rect. | 18 | 4 |
| 28 | 150.38 | wind | 9.0 | 90 | > th | dose independent | rect. | 18 | 4 |
| 50 | 150.43 | wind | 9.0 | 30 | > th | dose dependent | rect. | 21 | 5 |
| 75 | 150.50 | wind | 7.0 | 90 | > th | dose dependent | rect. | 20 | 1 |
| 442 | 154.62 | precipitation | 0.1 | 10 | > th | dose independent | rect. | 19 | 1 |
| 452 | 154.62 | precipitation | 0.1 | 10 | > th | dose dependent | rect. | 19 | 1 |
| 686 | 158.73 | wind | 9.0 | 30 | < th | dose independent | sin | 10 | NA |
| 688 | 158.74 | wind | 9.0 | 30 | > th | dose independent | sin | 10 | NA |
| 886 | 161.96 | wind | 7.0 | 30 | > th | dose dependent | sin | 10 | NA |
| 973 | 163.02 | radiation | 40.0 | 4320 | < th | dose dependent | rect. | 1 | 1 |
| 991 | 163.08 | temperature | 10.0 | 1440 | > th | dose independent | rect. | 1 | 1 |
| 994 | 163.08 | temperature | 30.0 | 1440 | < th | dose independent | rect. | 1 | 1 |
| 998 | 163.08 | humidity | 50.0 | 1440 | > th | dose independent | rect. | 1 | 1 |