Os10g0464000
blastp(Os)/ blastp(At)/ coex/// RAP/ RiceXPro/ SALAD/ ATTED-II
Description : Similar to Hypersensitive-induced response protein.

FiT-DB / Search/ Help/ Sample detail
|
Os10g0464000 |
blastp(Os)/ blastp(At)/ coex/// RAP/ RiceXPro/ SALAD/ ATTED-II |
|
Description : Similar to Hypersensitive-induced response protein.
|
|
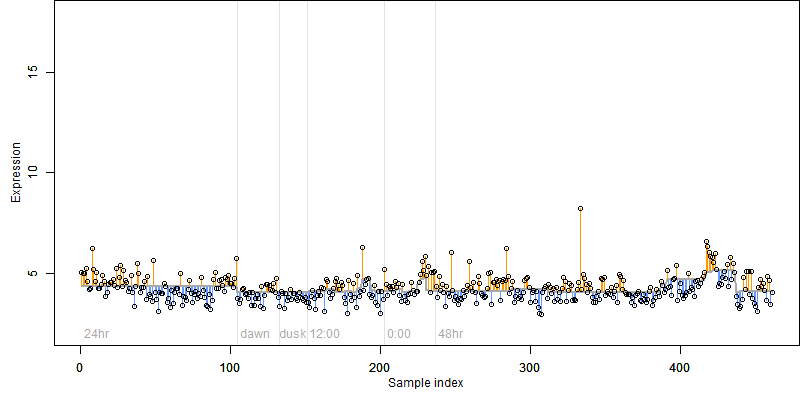
log2(Expression) ~ Norm(μ, σ2)
μ = α + β1D + β2C + β3E + β4D*C + β5D*E + γ1N8
|
_____ |
|

 __
__
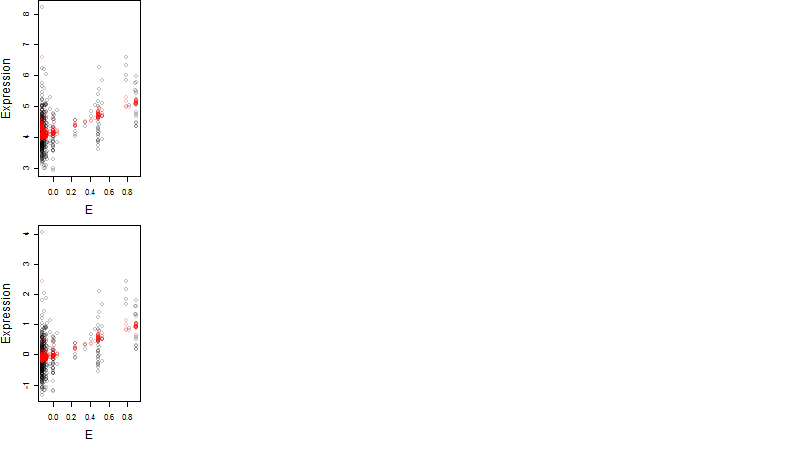
Dependence on each variable
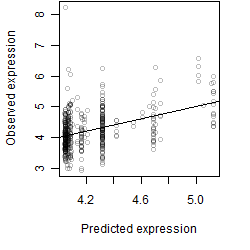
Residual plot

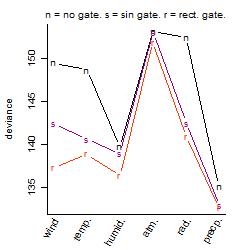
Process of the parameter reduction
(fixed parameters. wheather = precipitation,
response mode = > th, dose dependency = dose dependent, type of G = no)
| deviance | σ | α | β1 | β2 | β3 | β4 | β5 | γ1 | peak time of C | threshold | memory length | peak or start time of G | open length of G |
|---|---|---|---|---|---|---|---|---|---|---|---|---|---|
| 136.33 | 0.549 | 4.13 | -0.00903 | 0.34 | 0.436 | -1.31 | 3.26 | 0.194 | 7.63 | 0.08486 | 11180 | -- | -- |
| 145.1 | 0.561 | 4.16 | 9.35e-05 | 0.362 | 1.01 | -1.45 | -- | 0.244 | 7.48 | 0.1812 | 4839 | -- | -- |
| 140.02 | 0.551 | 4.14 | -0.0257 | 0.377 | 0.406 | -- | 3.25 | 0.186 | 6.27 | 0.1089 | 11178 | -- | -- |
| 148.36 | 0.567 | 4.15 | -0.0422 | 0.387 | 1.08 | -- | -- | 0.273 | 6.44 | 0.2189 | 4682 | -- | -- |
| 145.95 | 0.563 | 4.12 | 0.0154 | -- | 0.424 | -- | 3.27 | 0.197 | -- | 0.3128 | 14642 | -- | -- |
| 167.86 | 0.607 | 4.18 | 0.302 | 0.346 | -- | -1.29 | -- | 0.147 | 7.67 | -- | -- | -- | -- |
| 171.2 | 0.613 | 4.18 | 0.264 | 0.388 | -- | -- | -- | 0.146 | 6.16 | -- | -- | -- | -- |
| 150.25 | 0.571 | 4.16 | -0.145 | -- | 1.12 | -- | -- | 0.259 | -- | 0.4982 | 16300 | -- | -- |
| 148.34 | 0.567 | 4.16 | -- | 0.39 | 1.02 | -- | -- | 0.261 | 6.31 | 0.2137 | 4802 | -- | -- |
| 179.01 | 0.625 | 4.19 | 0.274 | -- | -- | -- | -- | 0.154 | -- | -- | -- | -- | -- |
| 173.04 | 0.615 | 4.19 | -- | 0.392 | -- | -- | -- | 0.116 | 6.13 | -- | -- | -- | -- |
| 150.49 | 0.571 | 4.16 | -- | -- | 1.08 | -- | -- | 0.273 | -- | 0.4814 | 15368 | -- | -- |
| 180.99 | 0.628 | 4.2 | -- | -- | -- | -- | -- | 0.124 | -- | -- | -- | -- | -- |
Results of the grid search
Summarized heatmap of deviance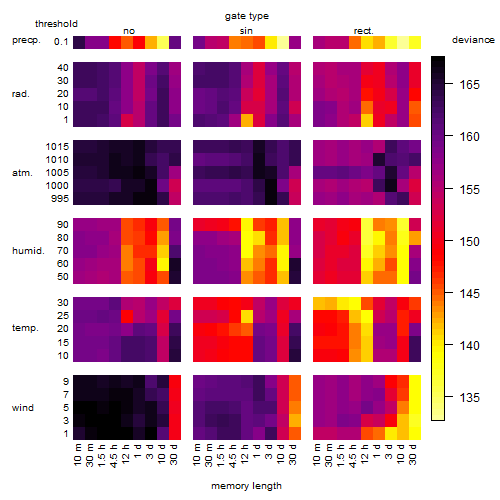
|
Histogram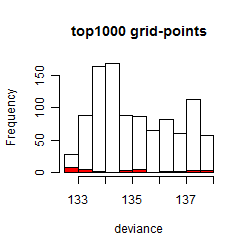 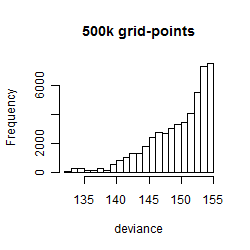
|
Local optima within top1000 grid-points
| rank | deviance | wheather | threshold | memory length | response mode | dose dependency | type of G | peak or start time of G | open length of G |
|---|---|---|---|---|---|---|---|---|---|
| 1 | 132.68 | precipitation | 0.1 | 14400 | < th | dose independent | rect. | 14 | 7 |
| 2 | 132.68 | precipitation | 0.1 | 14400 | < th | dose dependent | rect. | 14 | 7 |
| 5 | 132.76 | precipitation | 0.1 | 14400 | < th | dose independent | rect. | 12 | 9 |
| 6 | 132.76 | precipitation | 0.1 | 14400 | < th | dose dependent | rect. | 12 | 9 |
| 7 | 132.77 | precipitation | 0.1 | 14400 | > th | dose independent | rect. | 15 | 6 |
| 17 | 132.88 | precipitation | 0.1 | 14400 | < th | dose independent | sin | 20 | NA |
| 19 | 132.88 | precipitation | 0.1 | 14400 | < th | dose dependent | sin | 20 | NA |
| 25 | 132.97 | precipitation | 0.1 | 14400 | > th | dose independent | sin | 20 | NA |
| 46 | 133.18 | precipitation | 0.1 | 14400 | > th | dose dependent | rect. | 13 | 14 |
| 52 | 133.21 | precipitation | 0.1 | 14400 | > th | dose dependent | rect. | 9 | 18 |
| 73 | 133.30 | precipitation | 0.1 | 14400 | > th | dose dependent | rect. | 13 | 7 |
| 111 | 133.46 | precipitation | 0.1 | 14400 | > th | dose dependent | rect. | 15 | 5 |
| 128 | 133.57 | precipitation | 0.1 | 14400 | > th | dose dependent | sin | 19 | NA |
| 482 | 134.66 | precipitation | 0.1 | 14400 | > th | dose dependent | rect. | 16 | 1 |
| 532 | 134.97 | precipitation | 0.1 | 14400 | > th | dose dependent | rect. | 2 | 21 |
| 572 | 135.15 | precipitation | 0.1 | 14400 | > th | dose dependent | no | NA | NA |
| 583 | 135.17 | precipitation | 0.1 | 14400 | > th | dose dependent | rect. | 15 | 23 |
| 591 | 135.24 | precipitation | 0.1 | 14400 | > th | dose dependent | rect. | 21 | 23 |
| 594 | 135.25 | precipitation | 0.1 | 14400 | > th | dose dependent | rect. | 19 | 23 |
| 744 | 136.34 | humidity | 90.0 | 720 | > th | dose dependent | rect. | 8 | 15 |
| 807 | 136.91 | humidity | 90.0 | 14400 | > th | dose independent | rect. | 20 | 2 |
| 868 | 137.15 | humidity | 90.0 | 720 | > th | dose dependent | rect. | 12 | 11 |
| 890 | 137.30 | precipitation | 0.1 | 43200 | > th | dose dependent | rect. | 19 | 2 |
| 893 | 137.31 | wind | 3.0 | 43200 | > th | dose independent | rect. | 6 | 2 |
| 962 | 137.56 | wind | 3.0 | 43200 | < th | dose independent | rect. | 6 | 2 |
| 992 | 137.62 | humidity | 90.0 | 720 | > th | dose dependent | rect. | 15 | 8 |