Os07g0576100
blastp(Os)/ blastp(At)/ coex/// RAP/ RiceXPro/ SALAD/ ATTED-II
Description : GH3 auxin-responsive promoter family protein.


FiT-DB / Search/ Help/ Sample detail
|
Os07g0576100 |
blastp(Os)/ blastp(At)/ coex/// RAP/ RiceXPro/ SALAD/ ATTED-II |
|
Description : GH3 auxin-responsive promoter family protein.
|
|
log2(Expression) ~ Norm(μ, σ2)
μ = α + β1D + β2C + β3E + β4D*C + β5D*E + γ1N8
|
_____ |
|

 __
__
Dependence on each variable

Residual plot

Process of the parameter reduction
(fixed parameters. wheather = temperature,
response mode = > th, dose dependency = dose dependent, type of G = no)
| deviance | σ | α | β1 | β2 | β3 | β4 | β5 | γ1 | peak time of C | threshold | memory length | peak or start time of G | open length of G |
|---|---|---|---|---|---|---|---|---|---|---|---|---|---|
| 265.3 | 0.765 | 5.49 | 4.85 | 1.31 | -3.74 | 2.3 | 0.558 | 0.666 | 7.29 | 7.49 | 1670 | -- | -- |
| 265.55 | 0.759 | 5.51 | 4.73 | 1.32 | -3.74 | 2.31 | -- | 0.632 | 7.28 | 9.082 | 1661 | -- | -- |
| 279.45 | 0.779 | 5.49 | 4.92 | 1.31 | -3.75 | -- | 0.614 | 0.668 | 7.15 | 6.945 | 1671 | -- | -- |
| 279.1 | 0.778 | 5.51 | 4.84 | 1.12 | -3.65 | -- | -- | 0.644 | 6.53 | 3.967 | 2063 | -- | -- |
| 277.82 | 0.776 | 5.56 | 4.46 | -- | -4.34 | -- | -0.817 | 0.634 | -- | 15.84 | 582 | -- | -- |
| 496.44 | 1.04 | 5.66 | 3.53 | 1.4 | -- | 2.43 | -- | -0.0531 | 7.36 | -- | -- | -- | -- |
| 512.3 | 1.06 | 5.66 | 3.58 | 1.41 | -- | -- | -- | -0.0589 | 7.21 | -- | -- | -- | -- |
| 278.16 | 0.777 | 5.54 | 4.67 | -- | -4.43 | -- | -- | 0.65 | -- | 15.8 | 566 | -- | -- |
| 769.02 | 1.29 | 5.68 | -- | 0.95 | -1.8 | -- | -- | -0.148 | 7.57 | 20.1 | 397 | -- | -- |
| 616.97 | 1.16 | 5.69 | 3.61 | -- | -- | -- | -- | -0.0345 | -- | -- | -- | -- | -- |
| 850.62 | 1.36 | 5.75 | -- | 1.44 | -- | -- | -- | -0.458 | 7.05 | -- | -- | -- | -- |
| 788.02 | 1.31 | 5.7 | -- | -- | -2.53 | -- | -- | -0.0703 | -- | 20.4 | 486 | -- | -- |
| 960.43 | 1.45 | 5.78 | -- | -- | -- | -- | -- | -0.435 | -- | -- | -- | -- | -- |
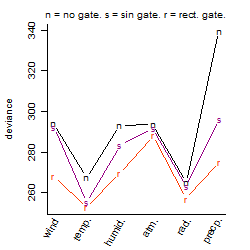
Results of the grid search
Summarized heatmap of deviance
|
Histogram 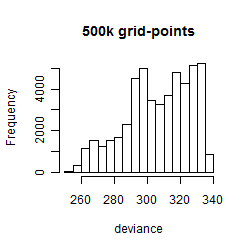
|
Local optima within top1000 grid-points
| rank | deviance | wheather | threshold | memory length | response mode | dose dependency | type of G | peak or start time of G | open length of G |
|---|---|---|---|---|---|---|---|---|---|
| 1 | 252.86 | temperature | 10 | 1440 | > th | dose dependent | rect. | 16 | 14 |
| 5 | 253.13 | temperature | 30 | 1440 | < th | dose dependent | rect. | 16 | 15 |
| 50 | 254.98 | temperature | 10 | 1440 | > th | dose dependent | sin | 13 | NA |
| 58 | 255.27 | temperature | 30 | 1440 | < th | dose dependent | sin | 13 | NA |
| 103 | 256.59 | temperature | 30 | 4320 | < th | dose dependent | rect. | 21 | 6 |
| 108 | 256.64 | temperature | 10 | 4320 | > th | dose dependent | rect. | 21 | 6 |
| 123 | 256.91 | radiation | 1 | 4320 | < th | dose dependent | rect. | 17 | 1 |
| 134 | 257.20 | temperature | 30 | 4320 | < th | dose dependent | rect. | 23 | 1 |
| 148 | 257.33 | temperature | 10 | 4320 | > th | dose dependent | rect. | 23 | 1 |
| 318 | 259.34 | radiation | 40 | 43200 | < th | dose dependent | rect. | 18 | 6 |
| 327 | 259.50 | temperature | 10 | 4320 | > th | dose dependent | rect. | 1 | 1 |
| 499 | 260.89 | radiation | 1 | 43200 | < th | dose independent | rect. | 17 | 12 |
| 538 | 261.15 | radiation | 1 | 14400 | < th | dose dependent | rect. | 16 | 15 |
| 592 | 261.63 | radiation | 1 | 14400 | < th | dose independent | rect. | 8 | 16 |
| 600 | 261.65 | radiation | 1 | 14400 | < th | dose independent | rect. | 8 | 10 |
| 650 | 261.84 | radiation | 1 | 14400 | < th | dose independent | rect. | 15 | 9 |
| 651 | 261.85 | radiation | 1 | 14400 | < th | dose independent | rect. | 15 | 7 |
| 669 | 261.94 | radiation | 1 | 14400 | < th | dose independent | rect. | 15 | 4 |
| 719 | 262.22 | radiation | 1 | 14400 | < th | dose dependent | rect. | 16 | 7 |
| 730 | 262.27 | radiation | 1 | 43200 | > th | dose independent | rect. | 17 | 12 |
| 767 | 262.47 | radiation | 1 | 14400 | > th | dose independent | rect. | 8 | 10 |
| 845 | 262.68 | radiation | 1 | 14400 | < th | dose dependent | rect. | 8 | 23 |
| 881 | 262.84 | radiation | 1 | 14400 | > th | dose independent | rect. | 15 | 4 |
| 903 | 262.87 | radiation | 1 | 14400 | < th | dose dependent | rect. | 16 | 19 |
| 905 | 262.88 | radiation | 1 | 14400 | < th | dose dependent | rect. | 4 | 3 |
| 966 | 263.20 | radiation | 1 | 14400 | < th | dose independent | sin | 17 | NA |