Os05g0162800
blastp(Os)/ blastp(At)/ coex/// RAP/ RiceXPro/ SALAD/ ATTED-II
Description : Homeodomain-like containing protein.


FiT-DB / Search/ Help/ Sample detail
|
Os05g0162800 |
blastp(Os)/ blastp(At)/ coex/// RAP/ RiceXPro/ SALAD/ ATTED-II |
|
Description : Homeodomain-like containing protein.
|
|
log2(Expression) ~ Norm(μ, σ2)
μ = α + β1D + β2C + β3E + β4D*C + β5D*E + γ1N8
|
_____ |
|

 __
__

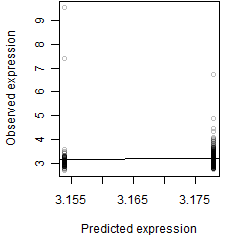
Dependence on each variable

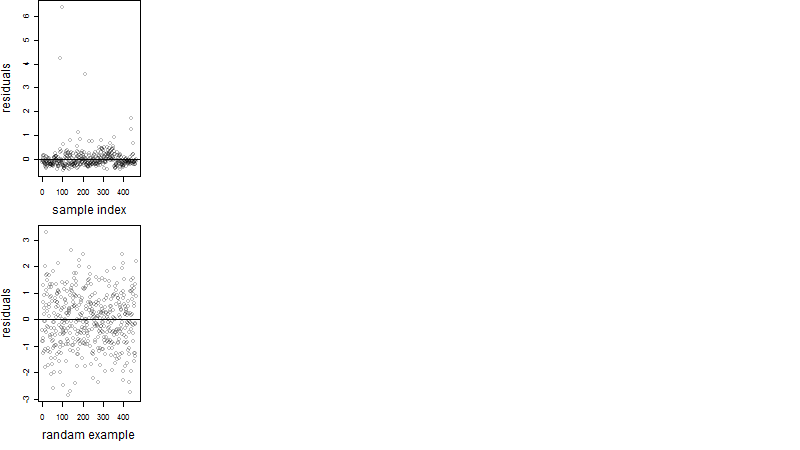
Residual plot
Process of the parameter reduction
(fixed parameters. wheather = wind,
response mode = < th, dose dependency = dose independent, type of G = no)
| deviance | σ | α | β1 | β2 | β3 | β4 | β5 | γ1 | peak time of C | threshold | memory length | peak or start time of G | open length of G |
|---|---|---|---|---|---|---|---|---|---|---|---|---|---|
| 97.31 | 0.463 | 3.16 | 0.125 | 0.177 | -0.634 | -0.0885 | 0.667 | 0.00748 | 6.66 | 9.2 | 669 | -- | -- |
| 86.7 | 0.437 | 3.17 | 0.101 | 0.175 | -3.66 | -0.0449 | -- | -0.00556 | 7 | 9.2 | 669 | -- | -- |
| 86.7 | 0.437 | -3.54 | -30.8 | 0.174 | 3090 | -- | 14300 | -0.0052 | 7.06 | 9.2 | 669 | -- | -- |
| 86.7 | 0.437 | 3.17 | 0.1 | 0.175 | -3.66 | -- | -- | -0.00539 | 7.07 | 9.2 | 669 | -- | -- |
| 97.36 | 0.462 | 3.19 | 0.157 | -- | -2.01 | -- | -4.06 | -0.00249 | -- | 8.9 | 436 | -- | -- |
| 99.94 | 0.469 | 3.17 | 0.0662 | 0.151 | -- | 0.0275 | -- | -0.0192 | 6.62 | -- | -- | -- | -- |
| 99.94 | 0.468 | 3.17 | 0.0665 | 0.151 | -- | -- | -- | -0.0193 | 6.54 | -- | -- | -- | -- |
| 88.31 | 0.44 | 3.17 | 0.103 | -- | -3.59 | -- | -- | -0.00249 | -- | 9.2 | 669 | -- | -- |
| 86.97 | 0.437 | 3.17 | -- | 0.176 | -3.63 | -- | -- | -0.0166 | 7.03 | 9.2 | 669 | -- | -- |
| 101.13 | 0.47 | 3.18 | 0.0702 | -- | -- | -- | -- | -0.0162 | -- | -- | -- | -- | -- |
| 100.06 | 0.468 | 3.17 | -- | 0.152 | -- | -- | -- | -0.0267 | 6.52 | -- | -- | -- | -- |
| 88.59 | 0.44 | 3.18 | -- | -- | -3.57 | -- | -- | -0.014 | -- | 9.2 | 669 | -- | -- |
| 101.26 | 0.47 | 3.18 | -- | -- | -- | -- | -- | -0.024 | -- | -- | -- | -- | -- |
Results of the grid search
Summarized heatmap of deviance
|
Histogram 
|
Local optima within top1000 grid-points
| rank | deviance | wheather | threshold | memory length | response mode | dose dependency | type of G | peak or start time of G | open length of G |
|---|---|---|---|---|---|---|---|---|---|
| 1 | 85.96 | wind | 5 | 90 | > th | dose dependent | rect. | 20 | 2 |
| 3 | 86.19 | wind | 5 | 10 | > th | dose dependent | rect. | 21 | 1 |
| 16 | 86.47 | wind | 7 | 90 | > th | dose independent | rect. | 21 | 1 |
| 18 | 86.59 | wind | 7 | 10 | > th | dose independent | rect. | 21 | 7 |
| 24 | 86.59 | wind | 7 | 10 | > th | dose dependent | rect. | 21 | 8 |
| 42 | 86.66 | wind | 9 | 30 | > th | dose independent | rect. | 21 | 5 |
| 61 | 86.66 | wind | 9 | 30 | > th | dose dependent | rect. | 21 | 5 |
| 81 | 86.68 | wind | 9 | 90 | > th | dose dependent | rect. | 18 | 4 |
| 249 | 87.20 | wind | 9 | 90 | > th | dose independent | rect. | 18 | 4 |
| 555 | 91.37 | wind | 9 | 30 | < th | dose independent | sin | 10 | NA |
| 643 | 92.62 | wind | 9 | 30 | > th | dose independent | sin | 10 | NA |
| 732 | 93.32 | atmosphere | 1005 | 10 | > th | dose dependent | rect. | 21 | 1 |
| 969 | 94.65 | wind | 7 | 30 | > th | dose dependent | sin | 10 | NA |
| 979 | 94.72 | humidity | 80 | 10 | < th | dose independent | rect. | 20 | 2 |