Os04g0686300
blastp(Os)/ blastp(At)/ coex/// RAP/ RiceXPro/ SALAD/ ATTED-II
Description : Protein of unknown function DUF167 family protein.


FiT-DB / Search/ Help/ Sample detail
|
Os04g0686300 |
blastp(Os)/ blastp(At)/ coex/// RAP/ RiceXPro/ SALAD/ ATTED-II |
|
Description : Protein of unknown function DUF167 family protein.
|
|
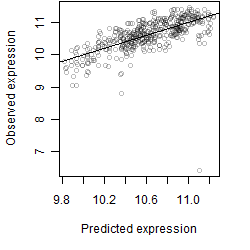
log2(Expression) ~ Norm(μ, σ2)
μ = α + β1D + β2C + β3E + β4D*C + β5D*E + γ1N8
|
_____ |
|
 __
__
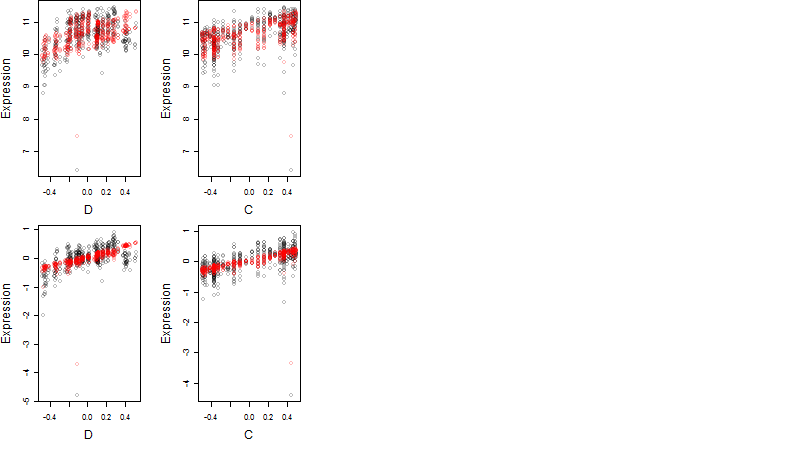
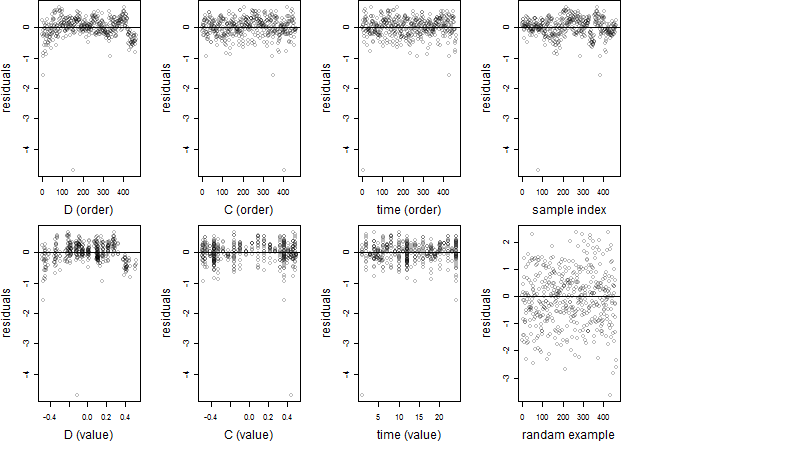
Dependence on each variable
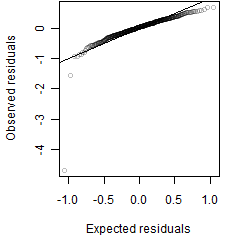
Residual plot
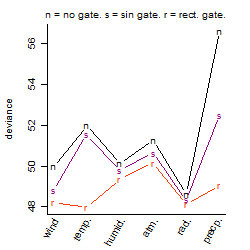
Process of the parameter reduction
(fixed parameters. wheather = temperature,
response mode = < th, dose dependency = dose independent, type of G = no)
| deviance | σ | α | β1 | β2 | β3 | β4 | β5 | γ1 | peak time of C | threshold | memory length | peak or start time of G | open length of G |
|---|---|---|---|---|---|---|---|---|---|---|---|---|---|
| 50.46 | 0.334 | 10.6 | 0.422 | 0.597 | -1.15 | 0.055 | -0.651 | 0.213 | 2.81 | 18.3 | 3842 | -- | -- |
| 50.8 | 0.332 | 10.6 | 0.375 | 0.599 | -0.969 | 0.0871 | -- | 0.202 | 2.81 | 18.34 | 3827 | -- | -- |
| 50.47 | 0.331 | 10.6 | 0.422 | 0.597 | -1.15 | -- | -0.659 | 0.213 | 2.82 | 18.32 | 3841 | -- | -- |
| 50.79 | 0.332 | 10.6 | 0.387 | 0.608 | -0.983 | -- | -- | 0.205 | 2.86 | 18.32 | 3644 | -- | -- |
| 70.89 | 0.392 | 10.5 | 0.419 | -- | -1.3 | -- | -0.878 | 0.218 | -- | 18.3 | 3884 | -- | -- |
| 61.93 | 0.369 | 10.5 | 0.853 | 0.638 | -- | -0.000262 | -- | 0.383 | 2.78 | -- | -- | -- | -- |
| 61.93 | 0.369 | 10.5 | 0.853 | 0.638 | -- | -- | -- | 0.383 | 2.77 | -- | -- | -- | -- |
| 70.45 | 0.391 | 10.6 | 0.394 | -- | -1.05 | -- | -- | 0.216 | -- | 18.3 | 2534 | -- | -- |
| 52.74 | 0.338 | 10.6 | -- | 0.629 | -1.1 | -- | -- | 0.118 | 2.73 | 18.3 | 10294 | -- | -- |
| 85.53 | 0.432 | 10.5 | 0.88 | -- | -- | -- | -- | 0.399 | -- | -- | -- | -- | -- |
| 81.1 | 0.421 | 10.6 | -- | 0.654 | -- | -- | -- | 0.288 | 2.79 | -- | -- | -- | -- |
| 73.83 | 0.4 | 10.6 | -- | -- | -1.19 | -- | -- | 0.114 | -- | 18.3 | 3945 | -- | -- |
| 105.96 | 0.48 | 10.6 | -- | -- | -- | -- | -- | 0.301 | -- | -- | -- | -- | -- |
Results of the grid search
Summarized heatmap of deviance
|
Histogram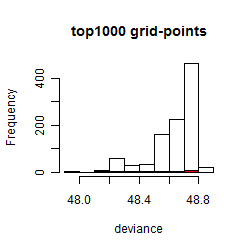 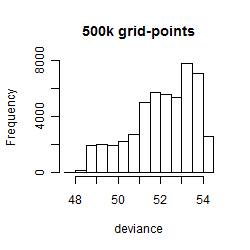
|
Local optima within top1000 grid-points
| rank | deviance | wheather | threshold | memory length | response mode | dose dependency | type of G | peak or start time of G | open length of G |
|---|---|---|---|---|---|---|---|---|---|
| 1 | 47.98 | temperature | 20 | 14400 | < th | dose independent | rect. | 21 | 1 |
| 2 | 48.12 | radiation | 30 | 43200 | < th | dose independent | rect. | 10 | 3 |
| 4 | 48.14 | temperature | 20 | 14400 | > th | dose independent | rect. | 21 | 1 |
| 14 | 48.22 | wind | 1 | 14400 | > th | dose independent | rect. | 23 | 3 |
| 16 | 48.22 | radiation | 30 | 43200 | < th | dose independent | rect. | 6 | 7 |
| 63 | 48.27 | radiation | 30 | 43200 | > th | dose dependent | rect. | 11 | 1 |
| 69 | 48.30 | radiation | 40 | 43200 | > th | dose independent | rect. | 11 | 1 |
| 71 | 48.32 | wind | 1 | 14400 | < th | dose independent | rect. | 22 | 4 |
| 74 | 48.34 | radiation | 30 | 43200 | < th | dose independent | sin | 7 | NA |
| 101 | 48.41 | wind | 9 | 43200 | > th | dose independent | rect. | 9 | 8 |
| 106 | 48.43 | radiation | 20 | 43200 | > th | dose dependent | rect. | 10 | 3 |
| 129 | 48.50 | wind | 9 | 43200 | > th | dose independent | rect. | 10 | 4 |
| 137 | 48.53 | radiation | 40 | 43200 | > th | dose independent | rect. | 10 | 4 |
| 153 | 48.54 | wind | 9 | 43200 | < th | dose independent | rect. | 9 | 8 |
| 228 | 48.60 | radiation | 30 | 43200 | < th | dose independent | no | NA | NA |
| 284 | 48.60 | radiation | 30 | 43200 | < th | dose independent | rect. | 9 | 23 |
| 294 | 48.61 | radiation | 10 | 43200 | < th | dose independent | rect. | 12 | 1 |
| 613 | 48.73 | radiation | 20 | 43200 | > th | dose dependent | sin | 7 | NA |
| 641 | 48.75 | radiation | 10 | 43200 | < th | dose independent | rect. | 5 | 3 |
| 694 | 48.76 | radiation | 40 | 43200 | > th | dose dependent | sin | 7 | NA |
| 839 | 48.79 | radiation | 10 | 43200 | < th | dose independent | rect. | 17 | 15 |
| 952 | 48.80 | wind | 9 | 43200 | > th | dose independent | sin | 22 | NA |
| 954 | 48.80 | radiation | 40 | 43200 | > th | dose independent | rect. | 13 | 1 |