Os03g0437200
blastp(Os)/ blastp(At)/ coex/// RAP/ RiceXPro/ SALAD/ ATTED-II
Description : Zinc finger, C2H2-type domain containing protein.

FiT-DB / Search/ Help/ Sample detail
|
Os03g0437200 |
blastp(Os)/ blastp(At)/ coex/// RAP/ RiceXPro/ SALAD/ ATTED-II |
|
Description : Zinc finger, C2H2-type domain containing protein.
|
|
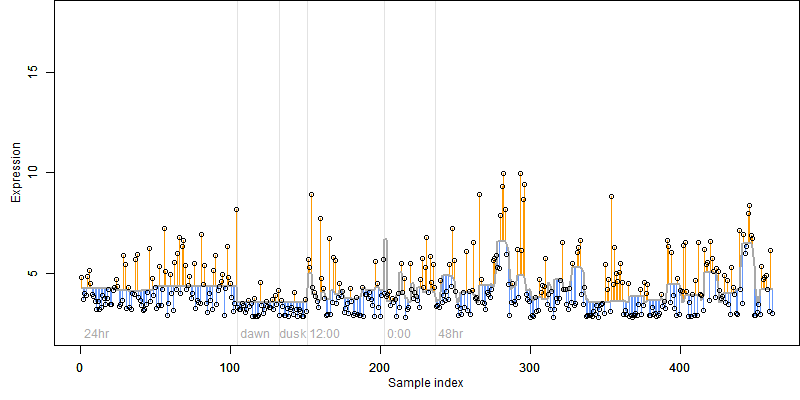
log2(Expression) ~ Norm(μ, σ2)
μ = α + β1D + β2C + β3E + β4D*C + β5D*E + γ1N8
|
_____ |
|
 __
__
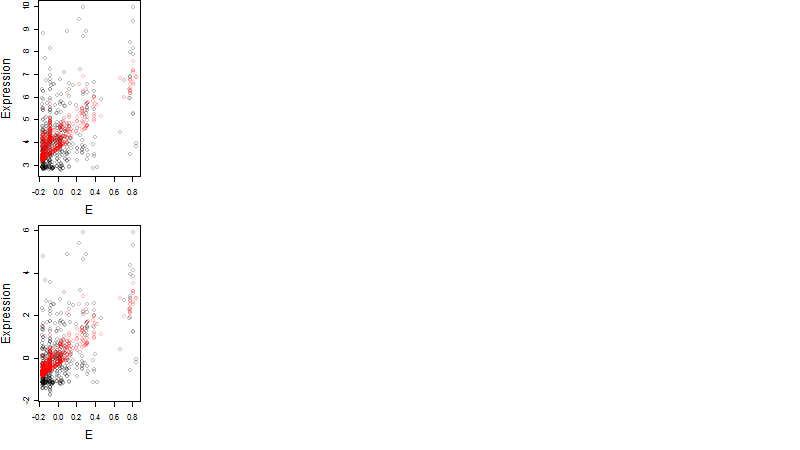
Dependence on each variable
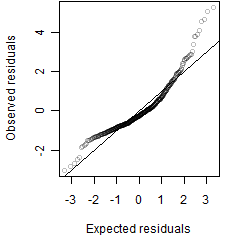
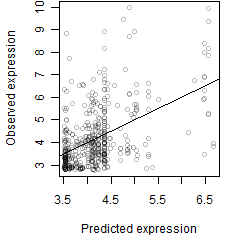
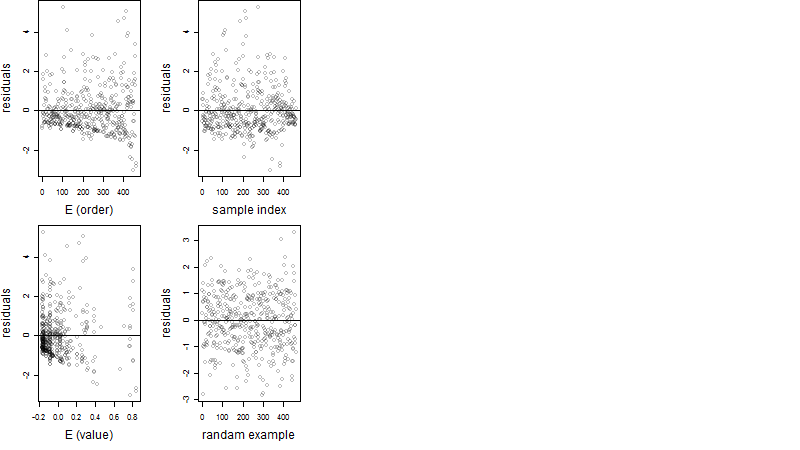
Residual plot
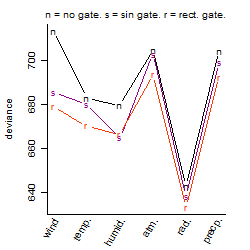
Process of the parameter reduction
(fixed parameters. wheather = radiation,
response mode = < th, dose dependency = dose dependent, type of G = rect.)
| deviance | σ | α | β1 | β2 | β3 | β4 | β5 | γ1 | peak time of C | threshold | memory length | peak or start time of G | open length of G |
|---|---|---|---|---|---|---|---|---|---|---|---|---|---|
| 604.67 | 1.16 | 4.04 | -0.0419 | 0.26 | 3.07 | 1.54 | -0.136 | 0.58 | 23.4 | 6.733 | 1172 | 8.43 | 9.31 |
| 604.15 | 1.14 | 4.04 | -0.014 | 0.254 | 3.17 | 1.61 | -- | 0.553 | 23.3 | 6.099 | 1169 | 8.45 | 9.37 |
| 612.88 | 1.15 | 4.05 | -0.134 | 0.309 | 3.14 | -- | 0.629 | 0.547 | 0.674 | 5.985 | 1165 | 8.43 | 9.37 |
| 613.44 | 1.15 | 4.05 | -0.095 | 0.283 | 3.1 | -- | -- | 0.556 | 0.826 | 6.078 | 1165 | 8.45 | 9.37 |
| 617.07 | 1.16 | 4.05 | -0.136 | -- | 3.24 | -- | 0.721 | 0.56 | -- | 6.049 | 1151 | 8.52 | 9.35 |
| 778.17 | 1.31 | 4.16 | -0.411 | 0.55 | -- | 0.945 | -- | 0.0821 | 0.375 | -- | -- | -- | -- |
| 781.78 | 1.31 | 4.16 | -0.45 | 0.553 | -- | -- | -- | 0.076 | 0.842 | -- | -- | -- | -- |
| 617.55 | 1.16 | 4.05 | -0.133 | -- | 3.17 | -- | -- | 0.553 | -- | 6.521 | 1147 | 8.52 | 9.35 |
| 613.62 | 1.15 | 4.05 | -- | 0.275 | 3.14 | -- | -- | 0.562 | 0.914 | 5.951 | 1165 | 8.45 | 9.35 |
| 800.85 | 1.32 | 4.15 | -0.429 | -- | -- | -- | -- | 0.0863 | -- | -- | -- | -- | -- |
| 787.11 | 1.31 | 4.15 | -- | 0.546 | -- | -- | -- | 0.126 | 0.805 | -- | -- | -- | -- |
| 617.66 | 1.16 | 4.04 | -- | -- | 3.16 | -- | -- | 0.571 | -- | 6.454 | 1151 | 8.52 | 9.33 |
| 805.71 | 1.32 | 4.14 | -- | -- | -- | -- | -- | 0.134 | -- | -- | -- | -- | -- |
Results of the grid search
Summarized heatmap of deviance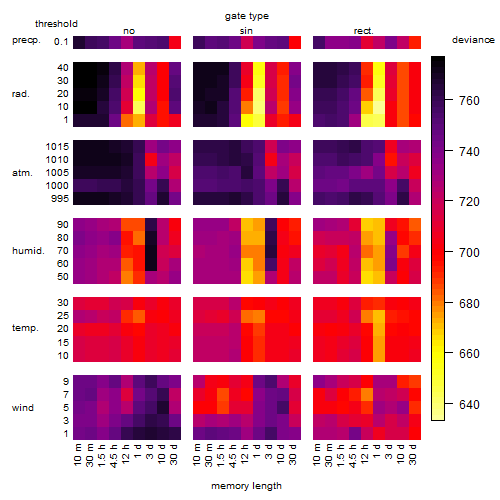
|
Histogram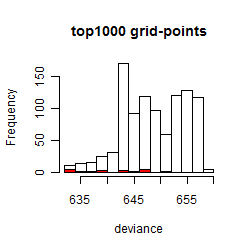 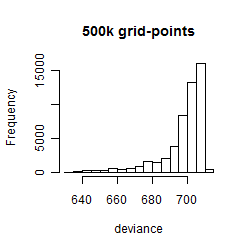
|
Local optima within top1000 grid-points
| rank | deviance | wheather | threshold | memory length | response mode | dose dependency | type of G | peak or start time of G | open length of G |
|---|---|---|---|---|---|---|---|---|---|
| 1 | 633.12 | radiation | 10 | 1440 | < th | dose dependent | rect. | 9 | 9 |
| 3 | 633.49 | radiation | 10 | 1440 | < th | dose dependent | rect. | 9 | 15 |
| 4 | 633.50 | radiation | 10 | 1440 | < th | dose dependent | rect. | 9 | 18 |
| 5 | 633.51 | radiation | 10 | 1440 | < th | dose dependent | rect. | 9 | 12 |
| 14 | 635.35 | radiation | 10 | 1440 | > th | dose independent | rect. | 9 | 22 |
| 27 | 637.02 | radiation | 10 | 1440 | > th | dose independent | rect. | 8 | 10 |
| 55 | 638.19 | radiation | 10 | 1440 | > th | dose independent | sin | 21 | NA |
| 58 | 638.64 | radiation | 10 | 1440 | < th | dose dependent | sin | 19 | NA |
| 136 | 642.60 | radiation | 10 | 1440 | > th | dose independent | no | NA | NA |
| 234 | 643.49 | radiation | 1 | 1440 | < th | dose independent | rect. | 8 | 22 |
| 267 | 644.02 | radiation | 10 | 1440 | > th | dose independent | rect. | 16 | 23 |
| 411 | 646.62 | radiation | 10 | 1440 | > th | dose independent | rect. | 13 | 23 |
| 424 | 646.77 | radiation | 1 | 1440 | < th | dose independent | rect. | 8 | 19 |
| 425 | 646.79 | radiation | 1 | 1440 | < th | dose independent | rect. | 8 | 13 |
| 426 | 646.79 | radiation | 1 | 1440 | < th | dose independent | rect. | 8 | 16 |
| 428 | 646.82 | radiation | 1 | 1440 | < th | dose independent | rect. | 8 | 11 |
| 596 | 650.38 | radiation | 1 | 1440 | < th | dose independent | sin | 18 | NA |