Os03g0372900
blastp(Os)/ blastp(At)/ coex/// RAP/ RiceXPro/ SALAD/ ATTED-II
Description : Cyclin-like F-box domain containing protein.


FiT-DB / Search/ Help/ Sample detail
|
Os03g0372900 |
blastp(Os)/ blastp(At)/ coex/// RAP/ RiceXPro/ SALAD/ ATTED-II |
|
Description : Cyclin-like F-box domain containing protein.
|
|
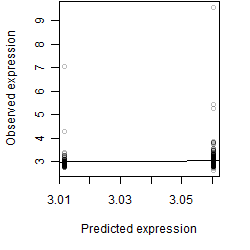
log2(Expression) ~ Norm(μ, σ2)
μ = α + β1D + β2C + β3E + β4D*C + β5D*E + γ1N8
|
_____ |
|

 __
__
Dependence on each variable

Residual plot
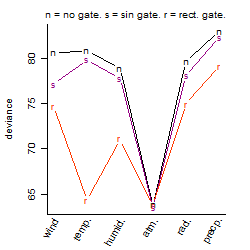
Process of the parameter reduction
(fixed parameters. wheather = atmosphere,
response mode = > th, dose dependency = dose dependent, type of G = no)
| deviance | σ | α | β1 | β2 | β3 | β4 | β5 | γ1 | peak time of C | threshold | memory length | peak or start time of G | open length of G |
|---|---|---|---|---|---|---|---|---|---|---|---|---|---|
| 63.81 | 0.372 | 3.05 | 0.038 | 0.13 | 1.71 | 0.169 | -4.57 | -0.0228 | 9.24 | 1015 | 10 | -- | -- |
| 72.57 | 0.4 | 3.05 | -0.0216 | 0.117 | 1.76 | 0.5 | -- | -0.0313 | 10.6 | 1015 | 10 | -- | -- |
| 63.88 | 0.375 | 3.05 | 0.0456 | 0.133 | 1.64 | -- | -4.48 | -0.0231 | 8.67 | 1015 | 12 | -- | -- |
| 67.98 | 0.384 | 3.09 | -0.109 | 0.0942 | 2.5 | -- | -- | -0.125 | 9.34 | 1016 | 2 | -- | -- |
| 64.87 | 0.377 | 3.06 | 0.0459 | -- | 1.59 | -- | -4.49 | -0.0225 | -- | 1015 | 12 | -- | -- |
| 83.22 | 0.428 | 3.06 | -0.0309 | 0.0331 | -- | 0.539 | -- | -0.0517 | 12.1 | -- | -- | -- | -- |
| 83.94 | 0.429 | 3.06 | -0.0125 | 0.106 | -- | -- | -- | -0.0516 | 7.2 | -- | -- | -- | -- |
| 67.5 | 0.383 | 3.05 | 0.0425 | -- | 2.79 | -- | -- | -0.0231 | -- | 1016 | 2 | -- | -- |
| 66.42 | 0.38 | 3.05 | -- | 0.141 | 2.84 | -- | -- | -0.0282 | 8.85 | 1016 | 2 | -- | -- |
| 84.54 | 0.43 | 3.06 | -0.0106 | -- | -- | -- | -- | -0.0497 | -- | -- | -- | -- | -- |
| 83.95 | 0.429 | 3.06 | -- | 0.106 | -- | -- | -- | -0.0502 | 7.21 | -- | -- | -- | -- |
| 65.09 | 0.377 | 3.06 | -- | -- | 3.13 | -- | -- | -0.031 | -- | 1016 | 2 | -- | -- |
| 84.55 | 0.429 | 3.06 | -- | -- | -- | -- | -- | -0.0485 | -- | -- | -- | -- | -- |
Results of the grid search
Summarized heatmap of deviance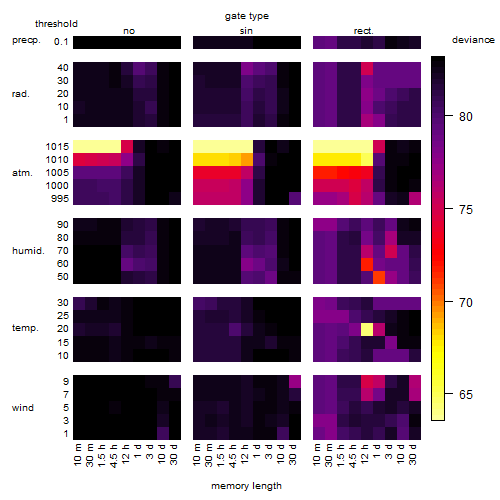
|
Histogram 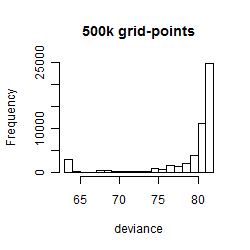
|
Local optima within top1000 grid-points
| rank | deviance | wheather | threshold | memory length | response mode | dose dependency | type of G | peak or start time of G | open length of G |
|---|---|---|---|---|---|---|---|---|---|
| 1 | 63.55 | atmosphere | 1015 | 10 | < th | dose independent | sin | 13 | NA |
| 5 | 63.55 | atmosphere | 1015 | 10 | < th | dose independent | sin | 1 | NA |
| 30 | 63.67 | atmosphere | 1015 | 10 | < th | dose independent | sin | 23 | NA |
| 35 | 63.71 | atmosphere | 1015 | 720 | < th | dose independent | sin | 21 | NA |
| 40 | 63.75 | atmosphere | 1015 | 720 | > th | dose dependent | rect. | 3 | 21 |
| 42 | 63.78 | atmosphere | 1015 | 720 | > th | dose independent | sin | 22 | NA |
| 44 | 63.80 | atmosphere | 1015 | 720 | > th | dose independent | rect. | 22 | 1 |
| 83 | 63.81 | atmosphere | 1015 | 10 | > th | dose independent | sin | 7 | NA |
| 179 | 63.81 | atmosphere | 1015 | 10 | > th | dose independent | no | NA | NA |
| 187 | 63.81 | atmosphere | 1015 | 10 | < th | dose independent | no | NA | NA |
| 197 | 63.81 | atmosphere | 1015 | 10 | > th | dose independent | rect. | 23 | 1 |