Os03g0131100
blastp(Os)/ blastp(At)/ coex/// RAP/ RiceXPro/ SALAD/ ATTED-II
Description : Plant regulator RWP-RK domain containing protein.


FiT-DB / Search/ Help/ Sample detail
|
Os03g0131100 |
blastp(Os)/ blastp(At)/ coex/// RAP/ RiceXPro/ SALAD/ ATTED-II |
|
Description : Plant regulator RWP-RK domain containing protein.
|
|
log2(Expression) ~ Norm(μ, σ2)
μ = α + β1D + β2C + β3E + β4D*C + β5D*E + γ1N8
|
_____ |
|
 __
__
Dependence on each variable

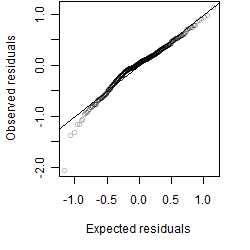
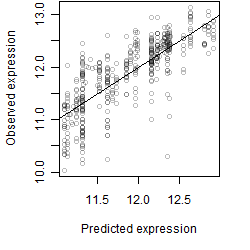
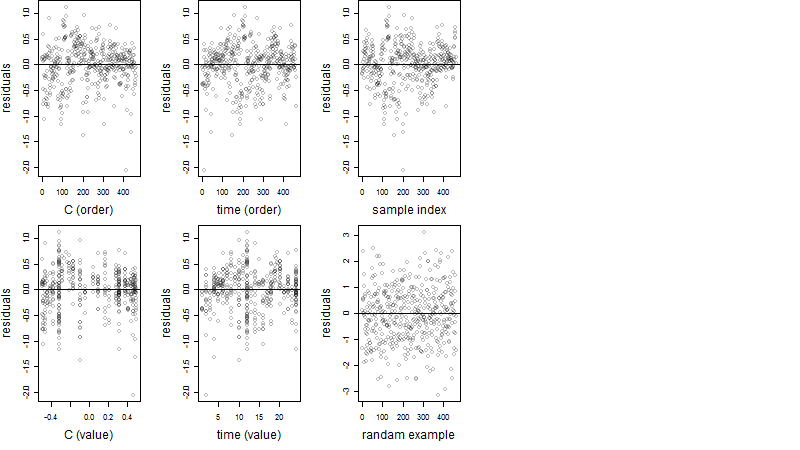
Residual plot
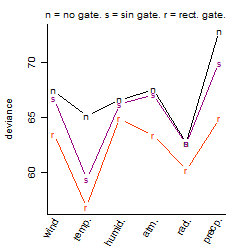
Process of the parameter reduction
(fixed parameters. wheather = radiation,
response mode = < th, dose dependency = dose dependent, type of G = no)
| deviance | σ | α | β1 | β2 | β3 | β4 | β5 | γ1 | peak time of C | threshold | memory length | peak or start time of G | open length of G |
|---|---|---|---|---|---|---|---|---|---|---|---|---|---|
| 62.15 | 0.37 | 11.7 | 0.0531 | 0.917 | 0.873 | 0.0588 | -0.343 | 0.591 | 5.11 | 40 | 75 | -- | -- |
| 62.51 | 0.368 | 11.7 | 0.0599 | 0.917 | 0.868 | -0.0364 | -- | 0.592 | 5.1 | 40 | 75 | -- | -- |
| 62.15 | 0.367 | 11.7 | 0.0535 | 0.92 | 0.871 | -- | -0.337 | 0.592 | 5.11 | 40 | 75 | -- | -- |
| 62.51 | 0.368 | 11.7 | 0.0625 | 0.915 | 0.876 | -- | -- | 0.591 | 5.12 | 40 | 75 | -- | -- |
| 74.03 | 0.401 | 11.7 | 0.0635 | -- | 1.3 | -- | -0.271 | 0.679 | -- | 19.96 | 372 | -- | -- |
| 74.66 | 0.405 | 11.7 | 0.0308 | 1.31 | -- | -0.149 | -- | 0.537 | 3.32 | -- | -- | -- | -- |
| 74.73 | 0.405 | 11.7 | 0.0336 | 1.31 | -- | -- | -- | 0.538 | 3.32 | -- | -- | -- | -- |
| 73.16 | 0.398 | 11.7 | 0.0261 | -- | 1.25 | -- | -- | 0.61 | -- | 10 | 427 | -- | -- |
| 62.62 | 0.369 | 11.7 | -- | 0.912 | 0.878 | -- | -- | 0.586 | 5.13 | 40 | 75 | -- | -- |
| 171.05 | 0.611 | 11.7 | 0.089 | -- | -- | -- | -- | 0.572 | -- | -- | -- | -- | -- |
| 74.76 | 0.404 | 11.7 | -- | 1.31 | -- | -- | -- | 0.534 | 3.32 | -- | -- | -- | -- |
| 73.15 | 0.398 | 11.7 | -- | -- | 1.27 | -- | -- | 0.601 | -- | 10 | 427 | -- | -- |
| 171.26 | 0.611 | 11.7 | -- | -- | -- | -- | -- | 0.562 | -- | -- | -- | -- | -- |
Results of the grid search
Summarized heatmap of deviance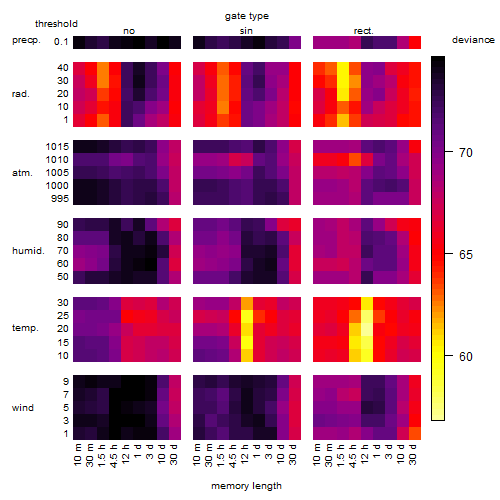
|
Histogram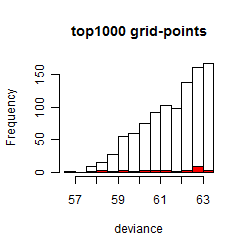 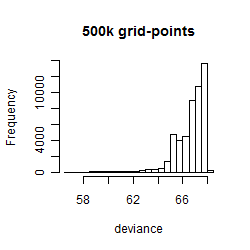
|
Local optima within top1000 grid-points
| rank | deviance | wheather | threshold | memory length | response mode | dose dependency | type of G | peak or start time of G | open length of G |
|---|---|---|---|---|---|---|---|---|---|
| 1 | 56.80 | temperature | 20 | 720 | < th | dose independent | rect. | 5 | 2 |
| 3 | 57.70 | temperature | 25 | 720 | < th | dose dependent | rect. | 5 | 4 |
| 17 | 58.22 | temperature | 15 | 720 | > th | dose dependent | rect. | 2 | 9 |
| 18 | 58.25 | temperature | 20 | 720 | > th | dose independent | rect. | 2 | 9 |
| 35 | 58.69 | temperature | 25 | 720 | < th | dose dependent | rect. | 7 | 1 |
| 76 | 59.22 | temperature | 15 | 720 | > th | dose dependent | rect. | 1 | 5 |
| 90 | 59.38 | temperature | 25 | 720 | < th | dose dependent | sin | 6 | NA |
| 126 | 59.74 | temperature | 15 | 720 | > th | dose dependent | sin | 6 | NA |
| 198 | 60.20 | radiation | 40 | 90 | < th | dose dependent | rect. | 17 | 20 |
| 215 | 60.29 | radiation | 40 | 90 | < th | dose dependent | rect. | 17 | 22 |
| 270 | 60.67 | radiation | 20 | 90 | < th | dose independent | rect. | 17 | 20 |
| 308 | 60.87 | radiation | 20 | 90 | < th | dose independent | rect. | 17 | 22 |
| 322 | 60.96 | temperature | 20 | 720 | > th | dose independent | sin | 5 | NA |
| 406 | 61.39 | temperature | 20 | 720 | < th | dose independent | sin | 5 | NA |
| 424 | 61.46 | radiation | 1 | 90 | > th | dose dependent | rect. | 11 | 23 |
| 493 | 61.73 | temperature | 10 | 270 | > th | dose dependent | rect. | 4 | 16 |
| 609 | 62.32 | radiation | 30 | 270 | < th | dose independent | rect. | 2 | 11 |
| 666 | 62.47 | radiation | 40 | 90 | < th | dose dependent | rect. | 1 | 23 |
| 689 | 62.59 | radiation | 30 | 90 | < th | dose dependent | no | NA | NA |
| 702 | 62.62 | radiation | 10 | 90 | < th | dose independent | sin | 22 | NA |
| 707 | 62.64 | radiation | 30 | 270 | < th | dose independent | rect. | 3 | 17 |
| 715 | 62.67 | radiation | 20 | 90 | < th | dose dependent | sin | 22 | NA |
| 726 | 62.71 | radiation | 30 | 270 | < th | dose independent | rect. | 1 | 21 |
| 744 | 62.77 | radiation | 30 | 90 | < th | dose dependent | rect. | 13 | 23 |
| 788 | 62.93 | radiation | 30 | 90 | < th | dose dependent | rect. | 3 | 23 |
| 799 | 62.97 | radiation | 1 | 90 | > th | dose dependent | rect. | 5 | 13 |
| 834 | 63.01 | radiation | 1 | 90 | > th | dose dependent | no | NA | NA |
| 912 | 63.06 | radiation | 30 | 270 | < th | dose independent | rect. | 23 | 23 |
| 955 | 63.12 | radiation | 20 | 90 | < th | dose independent | rect. | 3 | 21 |