Os02g0759000
blastp(Os)/ blastp(At)/ coex/// RAP/ RiceXPro/ SALAD/ ATTED-II
Description : Conserved hypothetical protein.

FiT-DB / Search/ Help/ Sample detail
|
Os02g0759000 |
blastp(Os)/ blastp(At)/ coex/// RAP/ RiceXPro/ SALAD/ ATTED-II |
|
Description : Conserved hypothetical protein.
|
|
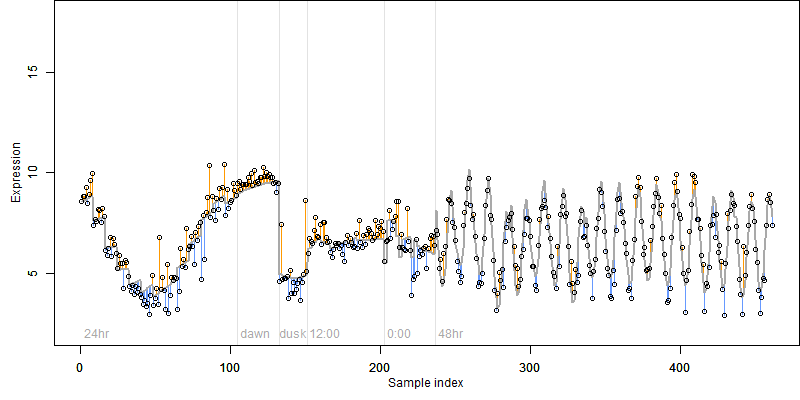
log2(Expression) ~ Norm(μ, σ2)
μ = α + β1D + β2C + β3E + β4D*C + β5D*E + γ1N8
|
_____ |
|
 __
__
Dependence on each variable

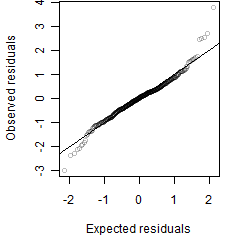
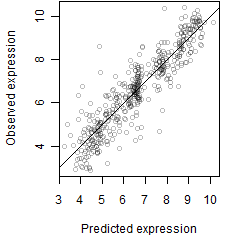
Residual plot

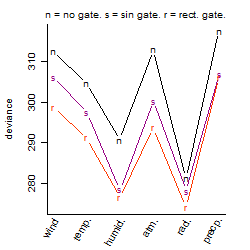
Process of the parameter reduction
(fixed parameters. wheather = radiation,
response mode = > th, dose dependency = dose independent, type of G = rect.)
| deviance | σ | α | β1 | β2 | β3 | β4 | β5 | γ1 | peak time of C | threshold | memory length | peak or start time of G | open length of G |
|---|---|---|---|---|---|---|---|---|---|---|---|---|---|
| 252.72 | 0.747 | 6.77 | -0.853 | 4.8 | 1.4 | 1.45 | -2.67 | -1.05 | 6.51 | 12.87 | 1224 | 10.6 | 7.1 |
| 269.56 | 0.765 | 6.75 | -0.466 | 4.86 | 1.37 | 1.83 | -- | -0.952 | 6.61 | 15.48 | 1166 | 11 | 7.09 |
| 255.35 | 0.744 | 6.77 | -0.875 | 4.87 | 1.51 | -- | -2.78 | -1.02 | 6.63 | 11.24 | 1169 | 10.7 | 7.6 |
| 275.98 | 0.774 | 6.73 | -0.488 | 4.93 | 1.33 | -- | -- | -0.874 | 6.59 | 11.41 | 1117 | 10.9 | 8.21 |
| 1126.61 | 1.57 | 6.76 | -0.0626 | -- | -1.89 | -- | 0.126 | -0.564 | -- | -97.52 | 1438 | 11.5 | 8.17 |
| 327.49 | 0.848 | 6.64 | -0.164 | 4.76 | -- | 1.49 | -- | -0.5 | 6.07 | -- | -- | -- | -- |
| 332.86 | 0.854 | 6.64 | -0.151 | 4.77 | -- | -- | -- | -0.506 | 6.05 | -- | -- | -- | -- |
| 593.44 | 1.13 | 6.82 | 0.763 | -- | -3.79 | -- | -- | -0.331 | -- | -142.7 | 17643 | 11.5 | 8.2 |
| 280.54 | 0.78 | 6.72 | -- | 4.91 | 1.25 | -- | -- | -0.839 | 6.57 | 16.18 | 1160 | 10.9 | 8.2 |
| 1511.4 | 1.82 | 6.72 | -0.0131 | -- | -- | -- | -- | -0.398 | -- | -- | -- | -- | -- |
| 333.46 | 0.854 | 6.64 | -- | 4.77 | -- | -- | -- | -0.489 | 6.05 | -- | -- | -- | -- |
| 327.95 | 0.843 | 6.65 | -- | -- | -4.58 | -- | -- | -0.392 | -- | -172.5 | 19213 | 7.35 | 13.2 |
| 1511.4 | 1.81 | 6.72 | -- | -- | -- | -- | -- | -0.396 | -- | -- | -- | -- | -- |
Results of the grid search
Summarized heatmap of deviance
|
Histogram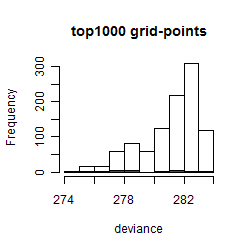 
|
Local optima within top1000 grid-points
| rank | deviance | wheather | threshold | memory length | response mode | dose dependency | type of G | peak or start time of G | open length of G |
|---|---|---|---|---|---|---|---|---|---|
| 1 | 274.09 | radiation | 20 | 1440 | < th | dose dependent | rect. | 11 | 6 |
| 6 | 275.65 | radiation | 20 | 1440 | < th | dose dependent | rect. | 11 | 16 |
| 7 | 275.66 | radiation | 20 | 1440 | < th | dose dependent | rect. | 11 | 11 |
| 11 | 275.68 | radiation | 20 | 1440 | < th | dose dependent | rect. | 11 | 14 |
| 29 | 276.53 | humidity | 90 | 720 | < th | dose dependent | rect. | 17 | 8 |
| 33 | 277.04 | radiation | 10 | 1440 | > th | dose independent | rect. | 11 | 6 |
| 37 | 277.41 | radiation | 20 | 1440 | < th | dose dependent | rect. | 11 | 3 |
| 41 | 277.54 | humidity | 50 | 720 | > th | dose dependent | rect. | 16 | 9 |
| 74 | 277.86 | radiation | 10 | 1440 | < th | dose independent | rect. | 12 | 5 |
| 75 | 277.86 | humidity | 90 | 720 | < th | dose dependent | rect. | 19 | 2 |
| 100 | 278.05 | radiation | 20 | 1440 | < th | dose dependent | sin | 19 | NA |
| 112 | 278.35 | humidity | 90 | 720 | < th | dose dependent | sin | 14 | NA |
| 142 | 278.53 | radiation | 10 | 1440 | > th | dose independent | sin | 20 | NA |
| 148 | 278.65 | humidity | 90 | 720 | < th | dose dependent | rect. | 15 | 15 |
| 331 | 280.77 | radiation | 10 | 1440 | > th | dose independent | rect. | 10 | 3 |
| 401 | 281.22 | radiation | 10 | 1440 | > th | dose independent | no | NA | NA |
| 476 | 281.34 | humidity | 90 | 720 | > th | dose independent | rect. | 20 | 4 |
| 505 | 281.49 | radiation | 10 | 1440 | < th | dose independent | rect. | 11 | 16 |
| 507 | 281.51 | radiation | 10 | 1440 | < th | dose independent | rect. | 11 | 11 |
| 512 | 281.52 | radiation | 10 | 1440 | < th | dose independent | rect. | 11 | 14 |
| 523 | 281.61 | radiation | 20 | 1440 | > th | dose independent | rect. | 15 | 23 |
| 686 | 282.10 | humidity | 50 | 720 | > th | dose dependent | rect. | 15 | 17 |
| 886 | 283.04 | radiation | 1 | 1440 | > th | dose dependent | rect. | 11 | 6 |