Os01g0821600
blastp(Os)/ blastp(At)/ coex/// RAP/ RiceXPro/ SALAD/ ATTED-II
Description : WRKY transcription factor 48-like protein (WRKY transcription factor 21).


FiT-DB / Search/ Help/ Sample detail
|
Os01g0821600 |
blastp(Os)/ blastp(At)/ coex/// RAP/ RiceXPro/ SALAD/ ATTED-II |
|
Description : WRKY transcription factor 48-like protein (WRKY transcription factor 21).
|
|
log2(Expression) ~ Norm(μ, σ2)
μ = α + β1D + β2C + β3E + β4D*C + β5D*E + γ1N8
|
_____ |
|

 __
__
Dependence on each variable

Residual plot

Process of the parameter reduction
(fixed parameters. wheather = temperature,
response mode = > th, dose dependency = dose independent, type of G = no)
| deviance | σ | α | β1 | β2 | β3 | β4 | β5 | γ1 | peak time of C | threshold | memory length | peak or start time of G | open length of G |
|---|---|---|---|---|---|---|---|---|---|---|---|---|---|
| 300.44 | 0.814 | 3.9 | -2 | 0.294 | 1.28 | 0.364 | -6.22 | 0.144 | 14.4 | 26.7 | 4500 | -- | -- |
| 303.46 | 0.811 | 3.78 | -1.56 | 0.322 | 1.62 | 0.431 | -- | 0.138 | 14.8 | 19.2 | 21003 | -- | -- |
| 300.75 | 0.808 | 3.9 | -2.01 | 0.287 | 1.29 | -- | -6.35 | 0.159 | 14.1 | 26.71 | 4509 | -- | -- |
| 303.21 | 0.811 | 3.79 | -1.67 | 0.322 | 1.68 | -- | -- | 0.119 | 13.9 | 18.9 | 22503 | -- | -- |
| 305.45 | 0.814 | 3.9 | -1.99 | -- | 1.25 | -- | -6.17 | 0.152 | -- | 26.8 | 4570 | -- | -- |
| 340 | 0.864 | 3.67 | -0.104 | 0.282 | -- | 0.344 | -- | 0.652 | 14.7 | -- | -- | -- | -- |
| 340.39 | 0.864 | 3.67 | -0.096 | 0.282 | -- | -- | -- | 0.654 | 14.4 | -- | -- | -- | -- |
| 309.01 | 0.819 | 3.79 | -1.7 | -- | 1.71 | -- | -- | 0.0991 | -- | 18.98 | 22398 | -- | -- |
| 327.75 | 0.843 | 3.74 | -- | 0.319 | 0.674 | -- | -- | 0.414 | 15.5 | 26.7 | 8722 | -- | -- |
| 345.1 | 0.868 | 3.67 | -0.108 | -- | -- | -- | -- | 0.647 | -- | -- | -- | -- | -- |
| 340.63 | 0.863 | 3.66 | -- | 0.284 | -- | -- | -- | 0.664 | 14.4 | -- | -- | -- | -- |
| 332.63 | 0.849 | 3.73 | -- | -- | 0.564 | -- | -- | 0.496 | -- | 25.1 | 8828 | -- | -- |
| 345.41 | 0.867 | 3.67 | -- | -- | -- | -- | -- | 0.659 | -- | -- | -- | -- | -- |
Results of the grid search
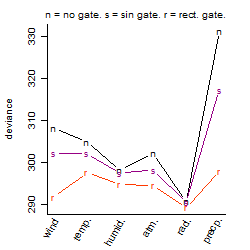
Summarized heatmap of deviance
|
Histogram 
|
Local optima within top1000 grid-points
| rank | deviance | wheather | threshold | memory length | response mode | dose dependency | type of G | peak or start time of G | open length of G |
|---|---|---|---|---|---|---|---|---|---|
| 1 | 289.26 | radiation | 40 | 43200 | < th | dose independent | rect. | 13 | 1 |
| 2 | 289.29 | radiation | 40 | 43200 | > th | dose independent | rect. | 11 | 3 |
| 3 | 289.37 | radiation | 1 | 43200 | < th | dose dependent | rect. | 19 | 10 |
| 4 | 289.38 | radiation | 30 | 43200 | > th | dose independent | rect. | 11 | 1 |
| 6 | 289.41 | radiation | 1 | 43200 | < th | dose dependent | rect. | 21 | 8 |
| 7 | 289.42 | radiation | 1 | 43200 | < th | dose dependent | rect. | 4 | 1 |
| 9 | 289.48 | radiation | 1 | 43200 | < th | dose dependent | rect. | 1 | 4 |
| 16 | 289.71 | radiation | 20 | 43200 | < th | dose independent | rect. | 13 | 2 |
| 17 | 289.77 | radiation | 30 | 43200 | < th | dose independent | rect. | 11 | 2 |
| 19 | 289.78 | radiation | 30 | 43200 | < th | dose independent | rect. | 9 | 6 |
| 26 | 289.85 | radiation | 20 | 43200 | > th | dose dependent | rect. | 11 | 3 |
| 31 | 289.87 | radiation | 40 | 43200 | > th | dose dependent | rect. | 13 | 1 |
| 83 | 290.05 | radiation | 10 | 43200 | > th | dose dependent | rect. | 11 | 1 |
| 96 | 290.08 | radiation | 20 | 43200 | < th | dose independent | rect. | 9 | 19 |
| 168 | 290.32 | radiation | 20 | 43200 | < th | dose independent | rect. | 3 | 13 |
| 172 | 290.33 | radiation | 20 | 43200 | < th | dose independent | sin | 22 | NA |
| 217 | 290.36 | radiation | 40 | 43200 | > th | dose independent | sin | 19 | NA |
| 393 | 290.58 | radiation | 10 | 43200 | > th | dose dependent | sin | 22 | NA |
| 493 | 290.67 | radiation | 20 | 43200 | < th | dose independent | no | NA | NA |
| 653 | 290.72 | radiation | 40 | 43200 | > th | dose independent | no | NA | NA |
| 823 | 290.73 | radiation | 10 | 43200 | > th | dose dependent | no | NA | NA |
| 981 | 290.78 | radiation | 20 | 43200 | < th | dose independent | rect. | 13 | 23 |
| 983 | 290.78 | radiation | 1 | 4320 | < th | dose dependent | rect. | 4 | 1 |
| 1000 | 290.79 | radiation | 10 | 43200 | > th | dose dependent | rect. | 13 | 23 |