Os01g0636400
blastp(Os)/ blastp(At)/ coex/// RAP/ RiceXPro/ SALAD/ ATTED-II
Description : Conserved hypothetical protein.

FiT-DB / Search/ Help/ Sample detail
|
Os01g0636400 |
blastp(Os)/ blastp(At)/ coex/// RAP/ RiceXPro/ SALAD/ ATTED-II |
|
Description : Conserved hypothetical protein.
|
|
log2(Expression) ~ Norm(μ, σ2)
μ = α + β1D + β2C + β3E + β4D*C + β5D*E + γ1N8
|
_____ |
|
 __
__
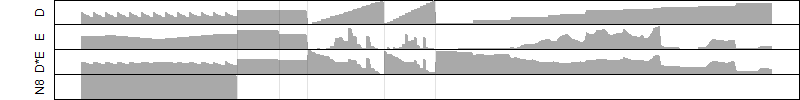
Dependence on each variable

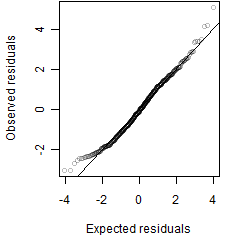
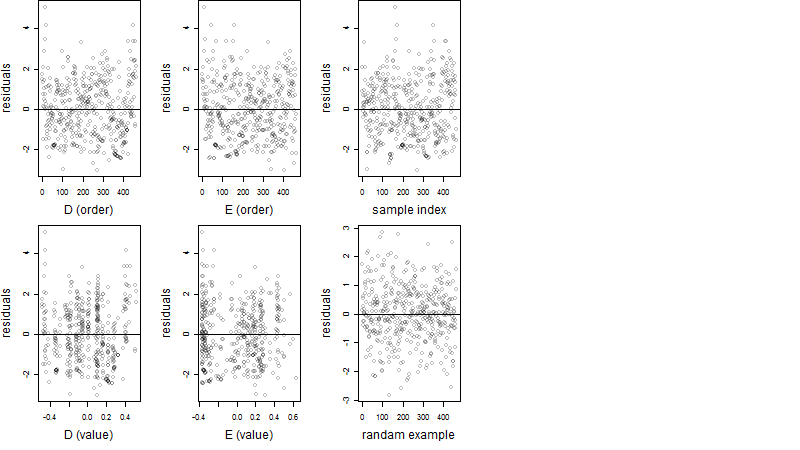
Residual plot
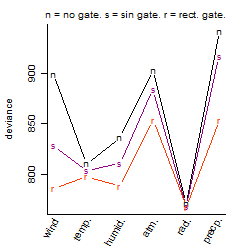
Process of the parameter reduction
(fixed parameters. wheather = temperature,
response mode = > th, dose dependency = dose dependent, type of G = sin)
| deviance | σ | α | β1 | β2 | β3 | β4 | β5 | γ1 | peak time of C | threshold | memory length | peak or start time of G | open length of G |
|---|---|---|---|---|---|---|---|---|---|---|---|---|---|
| 897.66 | 1.41 | 5.81 | -5.11 | 0.247 | 2.99 | -2.31 | -18.4 | -1.08 | 11.4 | 22.81 | 1267 | 5.94 | -- |
| 1088 | 1.54 | 5.25 | -0.196 | 0.206 | 1.35 | -2.71 | -- | 0.421 | 10.7 | 13.73 | 2186 | 5.05 | -- |
| 914.84 | 1.41 | 5.79 | -5.11 | 0.459 | 2.68 | -- | -16.8 | -1.05 | 7.97 | 22.59 | 1338 | 5.86 | -- |
| 1094.23 | 1.54 | 5.37 | -1.2 | 0.0552 | 2.32 | -- | -- | -0.00587 | 14 | -58.59 | 16886 | 7.35 | -- |
| 923.99 | 1.42 | 5.8 | -5.02 | -- | 2.84 | -- | -17.1 | -1.05 | -- | 22.5 | 1267 | 5.96 | -- |
| 1120.34 | 1.57 | 5.18 | 0.217 | 0.541 | -- | -2.23 | -- | 0.707 | 8.78 | -- | -- | -- | -- |
| 1133.72 | 1.58 | 5.18 | 0.133 | 0.618 | -- | -- | -- | 0.7 | 7.27 | -- | -- | -- | -- |
| 1092.64 | 1.54 | 5.35 | -1.09 | -- | 2.24 | -- | -- | 0.0361 | -- | -216.8 | 17135 | 9.28 | -- |
| 1096.42 | 1.54 | 5.27 | -- | 0.448 | 1.94 | -- | -- | 0.379 | 14.5 | -71.43 | 9619 | 8.74 | -- |
| 1153.96 | 1.59 | 5.2 | 0.143 | -- | -- | -- | -- | 0.71 | -- | -- | -- | -- | -- |
| 1134.18 | 1.58 | 5.19 | -- | 0.619 | -- | -- | -- | 0.685 | 7.26 | -- | -- | -- | -- |
| 1095.12 | 1.54 | 5.28 | -- | -- | 1.73 | -- | -- | 0.36 | -- | -67.46 | 8389 | 8.96 | -- |
| 1154.5 | 1.59 | 5.2 | -- | -- | -- | -- | -- | 0.694 | -- | -- | -- | -- | -- |
Results of the grid search
Summarized heatmap of deviance
|
Histogram 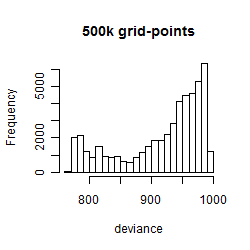
|
Local optima within top1000 grid-points
| rank | deviance | wheather | threshold | memory length | response mode | dose dependency | type of G | peak or start time of G | open length of G |
|---|---|---|---|---|---|---|---|---|---|
| 1 | 767.73 | radiation | 40 | 43200 | > th | dose independent | rect. | 14 | 22 |
| 4 | 768.77 | radiation | 40 | 43200 | > th | dose independent | sin | 7 | NA |
| 7 | 769.12 | radiation | 40 | 43200 | > th | dose independent | rect. | 8 | 5 |
| 33 | 770.58 | radiation | 40 | 43200 | > th | dose dependent | rect. | 11 | 2 |
| 35 | 770.73 | radiation | 1 | 43200 | > th | dose dependent | rect. | 11 | 1 |
| 39 | 771.39 | radiation | 20 | 43200 | > th | dose dependent | rect. | 9 | 4 |
| 80 | 771.77 | radiation | 1 | 43200 | > th | dose dependent | rect. | 10 | 3 |
| 101 | 771.89 | radiation | 40 | 43200 | > th | dose independent | no | NA | NA |
| 352 | 772.91 | radiation | 40 | 43200 | > th | dose independent | rect. | 9 | 1 |
| 358 | 772.98 | radiation | 40 | 43200 | > th | dose independent | rect. | 11 | 1 |
| 420 | 773.18 | radiation | 20 | 43200 | > th | dose dependent | sin | 5 | NA |
| 421 | 773.20 | radiation | 30 | 43200 | > th | dose dependent | sin | 2 | NA |
| 545 | 773.83 | radiation | 30 | 43200 | > th | dose dependent | no | NA | NA |
| 695 | 774.15 | radiation | 40 | 43200 | < th | dose dependent | rect. | 11 | 1 |