Os01g0590800
blastp(Os)/ blastp(At)/ coex/// RAP/ RiceXPro/ SALAD/ ATTED-II
Description : Conserved hypothetical protein.


FiT-DB / Search/ Help/ Sample detail
|
Os01g0590800 |
blastp(Os)/ blastp(At)/ coex/// RAP/ RiceXPro/ SALAD/ ATTED-II |
|
Description : Conserved hypothetical protein.
|
|
log2(Expression) ~ Norm(μ, σ2)
μ = α + β1D + β2C + β3E + β4D*C + β5D*E + γ1N8
|
_____ |
|

 __
__
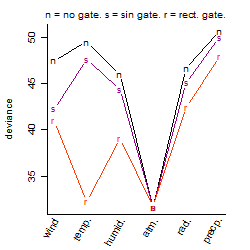
Dependence on each variable

Residual plot

Process of the parameter reduction
(fixed parameters. wheather = atmosphere,
response mode = > th, dose dependency = dose dependent, type of G = no)
| deviance | σ | α | β1 | β2 | β3 | β4 | β5 | γ1 | peak time of C | threshold | memory length | peak or start time of G | open length of G |
|---|---|---|---|---|---|---|---|---|---|---|---|---|---|
| 31.65 | 0.264 | 2.91 | 0.0114 | 0.0607 | 1.7 | -0.0312 | -4.53 | -0.00169 | 10.4 | 1015 | 10 | -- | -- |
| 40.31 | 0.298 | 2.91 | -0.0465 | 0.0612 | 1.75 | 0.265 | -- | -0.0107 | 11.7 | 1015 | 10 | -- | -- |
| 31.65 | 0.264 | 2.91 | 0.0118 | 0.0608 | 1.64 | -- | -4.36 | -0.00176 | 10.5 | 1015 | 13 | -- | -- |
| 40.6 | 0.299 | 2.91 | -0.0364 | 0.0634 | 1.75 | -- | -- | -0.0101 | 10.5 | 1015 | 10 | -- | -- |
| 31.88 | 0.264 | 2.91 | 0.0105 | -- | 1.61 | -- | -4.36 | -0.00236 | -- | 1015 | 19 | -- | -- |
| 50.83 | 0.334 | 2.92 | -0.0545 | 0.00174 | -- | -0.287 | -- | -0.0311 | 1.26 | -- | -- | -- | -- |
| 51.14 | 0.335 | 2.92 | -0.045 | 0.0227 | -- | -- | -- | -0.03 | 6.71 | -- | -- | -- | -- |
| 40.84 | 0.299 | 2.91 | -0.0377 | -- | 1.72 | -- | -- | -0.0107 | -- | 1015 | 10 | -- | -- |
| 40.63 | 0.299 | 2.91 | -- | 0.0637 | 1.75 | -- | -- | -0.00599 | 10.5 | 1015 | 10 | -- | -- |
| 51.17 | 0.334 | 2.92 | -0.0445 | -- | -- | -- | -- | -0.0295 | -- | -- | -- | -- | -- |
| 51.19 | 0.335 | 2.92 | -- | 0.0222 | -- | -- | -- | -0.0249 | 6.83 | -- | -- | -- | -- |
| 40.88 | 0.299 | 2.91 | -- | -- | 1.72 | -- | -- | -0.0065 | -- | 1015 | 10 | -- | -- |
| 51.22 | 0.334 | 2.92 | -- | -- | -- | -- | -- | -0.0246 | -- | -- | -- | -- | -- |
Results of the grid search
Summarized heatmap of deviance
|
Histogram 
|
Local optima within top1000 grid-points
| rank | deviance | wheather | threshold | memory length | response mode | dose dependency | type of G | peak or start time of G | open length of G |
|---|---|---|---|---|---|---|---|---|---|
| 1 | 31.63 | atmosphere | 1015 | 30 | < th | dose independent | sin | 12 | NA |
| 3 | 31.63 | atmosphere | 1015 | 270 | < th | dose independent | sin | 14 | NA |
| 4 | 31.63 | atmosphere | 1015 | 90 | < th | dose independent | sin | 0 | NA |
| 5 | 31.63 | atmosphere | 1015 | 270 | < th | dose independent | sin | 2 | NA |
| 6 | 31.64 | atmosphere | 1015 | 10 | < th | dose independent | sin | 10 | NA |
| 19 | 31.64 | atmosphere | 1015 | 10 | < th | dose independent | sin | 22 | NA |
| 25 | 31.64 | atmosphere | 1015 | 10 | < th | dose independent | sin | 1 | NA |
| 31 | 31.65 | atmosphere | 1015 | 10 | > th | dose independent | sin | 7 | NA |
| 127 | 31.65 | atmosphere | 1015 | 10 | > th | dose independent | no | NA | NA |
| 145 | 31.65 | atmosphere | 1015 | 10 | < th | dose independent | no | NA | NA |
| 149 | 31.65 | atmosphere | 1015 | 270 | > th | dose independent | rect. | 20 | 1 |
| 156 | 31.65 | atmosphere | 1015 | 10 | > th | dose independent | rect. | 23 | 1 |