Os01g0226200
blastp(Os)/ blastp(At)/ coex/// RAP/ RiceXPro/ SALAD/ ATTED-II
Description : Conserved hypothetical protein.

FiT-DB / Search/ Help/ Sample detail
|
Os01g0226200 |
blastp(Os)/ blastp(At)/ coex/// RAP/ RiceXPro/ SALAD/ ATTED-II |
|
Description : Conserved hypothetical protein.
|
|
log2(Expression) ~ Norm(μ, σ2)
μ = α + β1D + β2C + β3E + β4D*C + β5D*E + γ1N8
|
_____ |
|
 __
__

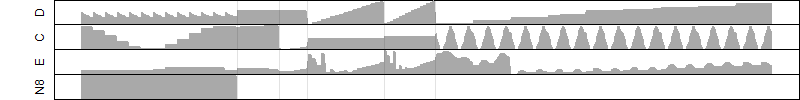
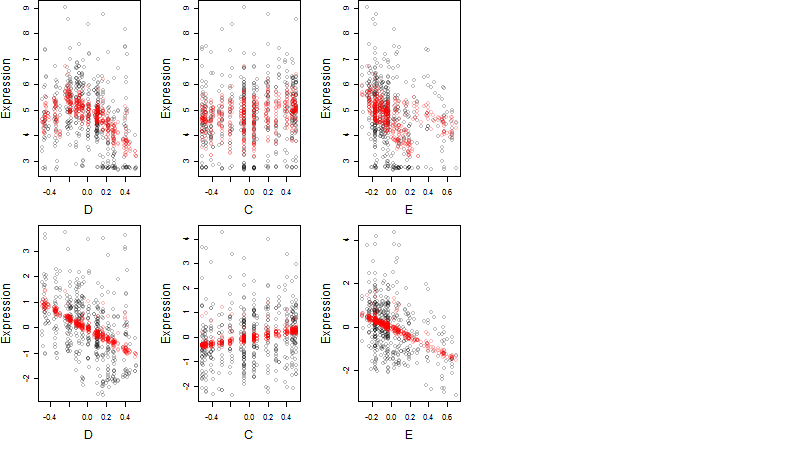
Dependence on each variable
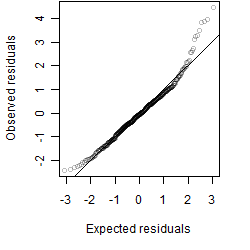
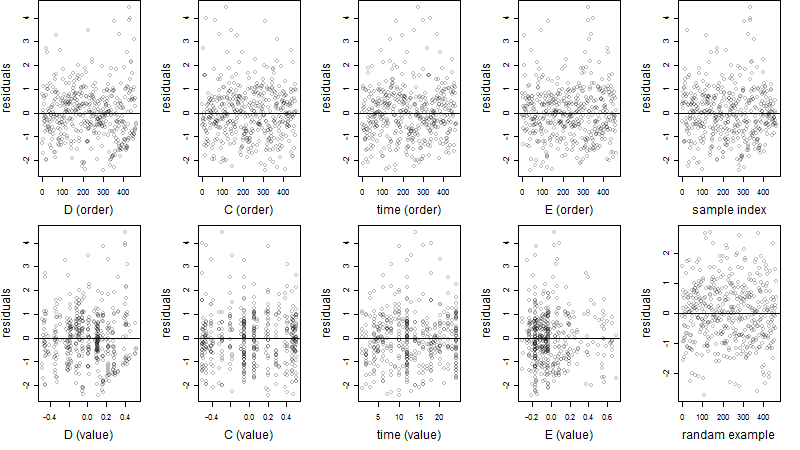
Residual plot
Process of the parameter reduction
(fixed parameters. wheather = radiation,
response mode = < th, dose dependency = dose dependent, type of G = no)
| deviance | σ | α | β1 | β2 | β3 | β4 | β5 | γ1 | peak time of C | threshold | memory length | peak or start time of G | open length of G |
|---|---|---|---|---|---|---|---|---|---|---|---|---|---|
| 523.09 | 1.07 | 4.83 | -2.32 | 0.577 | -1.54 | -1.1 | 1.83 | -0.16 | 7.28 | 0.67 | 4366 | -- | -- |
| 525.96 | 1.07 | 4.83 | -2.04 | 0.568 | -1.95 | -1.15 | -- | -0.166 | 7.28 | 0.6696 | 4374 | -- | -- |
| 525.32 | 1.07 | 4.83 | -2.35 | 0.578 | -1.62 | -- | 1.93 | -0.169 | 6.58 | 0.7146 | 4406 | -- | -- |
| 528.09 | 1.07 | 4.81 | -2.05 | 0.627 | -2.07 | -- | -- | -0.143 | 5.64 | 0.6229 | 4447 | -- | -- |
| 542.86 | 1.09 | 4.84 | -2.37 | -- | -1.61 | -- | 2.05 | -0.159 | -- | 0.7268 | 4400 | -- | -- |
| 594.41 | 1.14 | 4.71 | -1.35 | 0.605 | -- | -1.18 | -- | 0.238 | 7.75 | -- | -- | -- | -- |
| 598.35 | 1.15 | 4.71 | -1.38 | 0.607 | -- | -- | -- | 0.239 | 7.61 | -- | -- | -- | -- |
| 545.37 | 1.09 | 4.8 | -2.04 | -- | -1.98 | -- | -- | -0.114 | -- | 0.6301 | 4390 | -- | -- |
| 622.26 | 1.16 | 4.72 | -- | 0.567 | -1.18 | -- | -- | 0.207 | 6.72 | 1.2 | 4438 | -- | -- |
| 618.16 | 1.16 | 4.72 | -1.37 | -- | -- | -- | -- | 0.248 | -- | -- | -- | -- | -- |
| 648.73 | 1.19 | 4.67 | -- | 0.596 | -- | -- | -- | 0.393 | 7.77 | -- | -- | -- | -- |
| 638.91 | 1.18 | 4.73 | -- | -- | -1.19 | -- | -- | 0.215 | -- | 1.2 | 4404 | -- | -- |
| 667.96 | 1.21 | 4.69 | -- | -- | -- | -- | -- | 0.401 | -- | -- | -- | -- | -- |
Results of the grid search
Summarized heatmap of deviance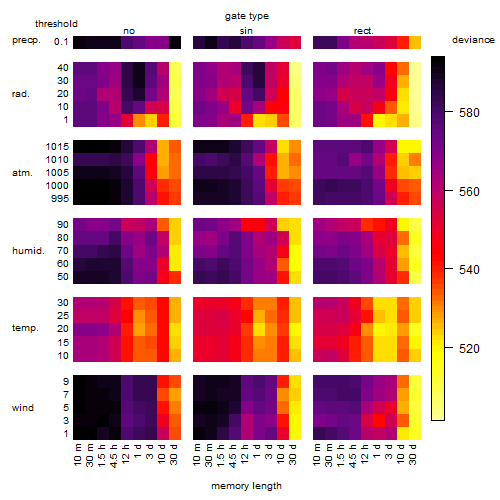
|
Histogram 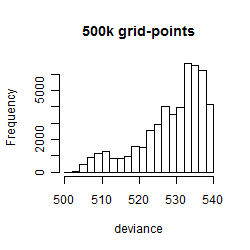
|
Local optima within top1000 grid-points
| rank | deviance | wheather | threshold | memory length | response mode | dose dependency | type of G | peak or start time of G | open length of G |
|---|---|---|---|---|---|---|---|---|---|
| 1 | 501.24 | radiation | 40 | 43200 | > th | dose independent | rect. | 11 | 1 |
| 2 | 501.74 | radiation | 40 | 43200 | > th | dose independent | rect. | 9 | 1 |
| 3 | 501.90 | radiation | 20 | 43200 | > th | dose dependent | rect. | 9 | 1 |
| 4 | 501.95 | radiation | 30 | 43200 | < th | dose independent | rect. | 9 | 2 |
| 5 | 501.97 | radiation | 40 | 43200 | > th | dose independent | rect. | 9 | 3 |
| 11 | 502.39 | radiation | 10 | 43200 | < th | dose independent | rect. | 12 | 1 |
| 36 | 503.03 | radiation | 20 | 43200 | > th | dose dependent | rect. | 9 | 3 |
| 66 | 503.54 | radiation | 20 | 43200 | > th | dose dependent | rect. | 11 | 1 |
| 79 | 504.01 | radiation | 40 | 43200 | > th | dose independent | sin | 9 | NA |
| 92 | 504.16 | radiation | 30 | 43200 | < th | dose independent | rect. | 22 | 16 |
| 93 | 504.16 | radiation | 30 | 43200 | < th | dose independent | rect. | 20 | 18 |
| 218 | 504.89 | radiation | 40 | 43200 | < th | dose dependent | rect. | 9 | 1 |
| 356 | 505.30 | radiation | 30 | 43200 | < th | dose independent | rect. | 13 | 1 |
| 403 | 505.54 | radiation | 30 | 43200 | < th | dose independent | sin | 7 | NA |
| 454 | 505.67 | radiation | 10 | 43200 | > th | dose dependent | sin | 7 | NA |
| 662 | 506.44 | radiation | 20 | 43200 | > th | dose independent | sin | 9 | NA |
| 717 | 506.61 | radiation | 40 | 43200 | < th | dose dependent | rect. | 22 | 16 |
| 961 | 507.23 | radiation | 40 | 43200 | > th | dose independent | no | NA | NA |