Os12g0624100
blastp(Os)/ blastp(At)/ coex/// RAP/ RiceXPro/ SALAD/ ATTED-II
Description : Conserved hypothetical protein.

FiT-DB / Search/ Help/ Sample detail
|
Os12g0624100 |
blastp(Os)/ blastp(At)/ coex/// RAP/ RiceXPro/ SALAD/ ATTED-II |
|
Description : Conserved hypothetical protein.
|
|
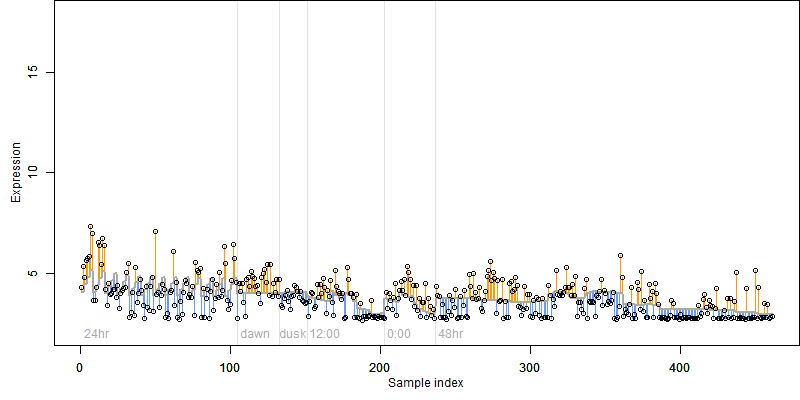
log2(Expression) ~ Norm(μ, σ2)
μ = α + β1D + β2C + β3E + β4D*C + β5D*E + γ1N8
|
_____ |
|

 __
__
Dependence on each variable

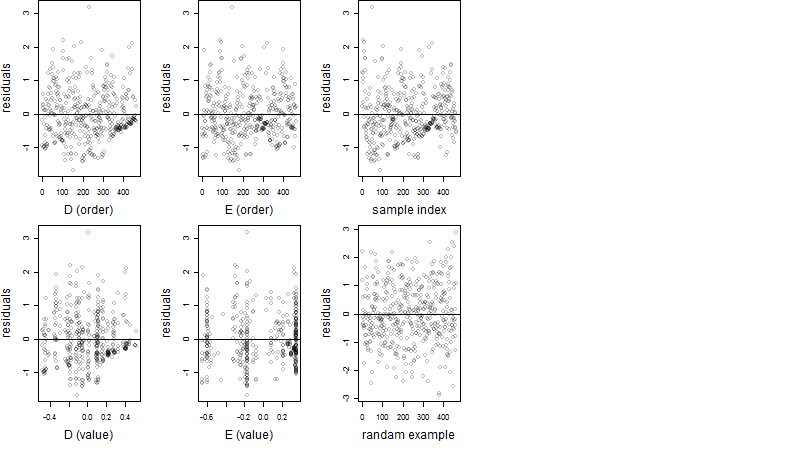
Residual plot
Process of the parameter reduction
(fixed parameters. wheather = temperature,
response mode = < th, dose dependency = dose independent, type of G = no)
| deviance | σ | α | β1 | β2 | β3 | β4 | β5 | γ1 | peak time of C | threshold | memory length | peak or start time of G | open length of G |
|---|---|---|---|---|---|---|---|---|---|---|---|---|---|
| 243.5 | 0.733 | 3.84 | -2.57 | 0.541 | -1.15 | -1.17 | 3.86 | -0.0997 | 7.76 | 25.12 | 8260 | -- | -- |
| 247.01 | 0.732 | 3.72 | -2.11 | 0.554 | -1.54 | -0.883 | -- | 0.0434 | 7.41 | 20.3 | 13533 | -- | -- |
| 243.01 | 0.726 | 3.85 | -2.72 | 0.563 | -1.21 | -- | 4.12 | -0.255 | 7.63 | 28.8 | 8556 | -- | -- |
| 249.34 | 0.735 | 3.73 | -2.22 | 0.523 | -1.61 | -- | -- | 0.0312 | 6.86 | 20.4 | 13475 | -- | -- |
| 247.96 | 0.733 | 3.93 | -3.51 | -- | -1.57 | -- | 7.77 | -0.313 | -- | 29.8 | 8554 | -- | -- |
| 287.7 | 0.795 | 3.6 | -0.839 | 0.539 | -- | -1.05 | -- | 0.594 | 7.28 | -- | -- | -- | -- |
| 290.24 | 0.798 | 3.6 | -0.865 | 0.549 | -- | -- | -- | 0.594 | 6.7 | -- | -- | -- | -- |
| 264.94 | 0.758 | 3.74 | -2.3 | -- | -1.63 | -- | -- | 0.0271 | -- | 20.3 | 14542 | -- | -- |
| 296.9 | 0.803 | 3.69 | -- | 0.557 | -0.696 | -- | -- | 0.326 | 7.02 | 23.2 | 2182 | -- | -- |
| 305.98 | 0.817 | 3.61 | -0.852 | -- | -- | -- | -- | 0.605 | -- | -- | -- | -- | -- |
| 309.95 | 0.824 | 3.58 | -- | 0.539 | -- | -- | -- | 0.69 | 6.8 | -- | -- | -- | -- |
| 310.17 | 0.82 | 3.63 | -- | -- | -0.538 | -- | -- | 0.482 | -- | 23.7 | 1319 | -- | -- |
| 325.13 | 0.842 | 3.59 | -- | -- | -- | -- | -- | 0.7 | -- | -- | -- | -- | -- |
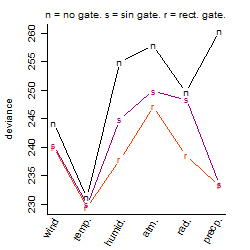
Results of the grid search
Summarized heatmap of deviance
|
Histogram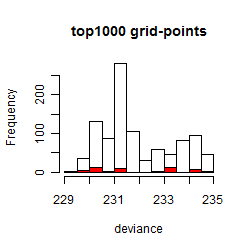 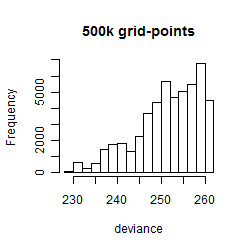
|
Local optima within top1000 grid-points
| rank | deviance | wheather | threshold | memory length | response mode | dose dependency | type of G | peak or start time of G | open length of G |
|---|---|---|---|---|---|---|---|---|---|
| 1 | 229.46 | temperature | 30.0 | 14400 | > th | dose independent | rect. | 12 | 1 |
| 2 | 229.52 | temperature | 30.0 | 14400 | > th | dose dependent | rect. | 14 | 1 |
| 3 | 229.75 | temperature | 30.0 | 14400 | > th | dose independent | rect. | 11 | 7 |
| 33 | 229.88 | temperature | 30.0 | 14400 | < th | dose independent | rect. | 12 | 1 |
| 34 | 229.92 | temperature | 30.0 | 14400 | > th | dose independent | sin | 15 | NA |
| 38 | 230.01 | temperature | 30.0 | 14400 | < th | dose independent | rect. | 11 | 7 |
| 40 | 230.02 | temperature | 30.0 | 14400 | < th | dose independent | rect. | 11 | 17 |
| 49 | 230.04 | temperature | 30.0 | 14400 | < th | dose independent | rect. | 11 | 13 |
| 56 | 230.09 | temperature | 30.0 | 14400 | < th | dose independent | sin | 14 | NA |
| 58 | 230.10 | temperature | 30.0 | 14400 | > th | dose independent | rect. | 14 | 5 |
| 92 | 230.23 | temperature | 30.0 | 14400 | > th | dose independent | rect. | 16 | 1 |
| 113 | 230.30 | temperature | 30.0 | 14400 | < th | dose independent | rect. | 15 | 16 |
| 114 | 230.31 | temperature | 30.0 | 14400 | > th | dose independent | rect. | 12 | 3 |
| 115 | 230.31 | temperature | 30.0 | 14400 | < th | dose independent | rect. | 15 | 14 |
| 132 | 230.33 | temperature | 30.0 | 14400 | < th | dose independent | rect. | 15 | 3 |
| 138 | 230.35 | temperature | 30.0 | 14400 | < th | dose independent | rect. | 15 | 10 |
| 169 | 230.51 | temperature | 30.0 | 14400 | < th | dose independent | rect. | 16 | 1 |
| 296 | 231.16 | temperature | 30.0 | 14400 | < th | dose independent | rect. | 2 | 16 |
| 297 | 231.16 | temperature | 30.0 | 14400 | < th | dose independent | rect. | 23 | 19 |
| 306 | 231.18 | temperature | 30.0 | 14400 | < th | dose independent | rect. | 6 | 12 |
| 311 | 231.21 | temperature | 30.0 | 14400 | > th | dose independent | no | NA | NA |
| 399 | 231.21 | temperature | 30.0 | 14400 | > th | dose independent | rect. | 14 | 23 |
| 405 | 231.21 | temperature | 30.0 | 14400 | < th | dose independent | rect. | 14 | 23 |
| 408 | 231.24 | temperature | 30.0 | 14400 | < th | dose independent | rect. | 2 | 22 |
| 411 | 231.25 | temperature | 30.0 | 14400 | < th | dose independent | no | NA | NA |
| 429 | 231.25 | temperature | 30.0 | 14400 | < th | dose independent | rect. | 6 | 22 |
| 455 | 231.26 | temperature | 30.0 | 14400 | < th | dose independent | rect. | 6 | 18 |
| 728 | 232.93 | temperature | 30.0 | 14400 | > th | dose dependent | sin | 14 | NA |
| 741 | 233.20 | temperature | 25.0 | 14400 | > th | dose dependent | rect. | 16 | 14 |
| 743 | 233.22 | precipitation | 0.1 | 43200 | < th | dose independent | rect. | 4 | 13 |
| 744 | 233.22 | precipitation | 0.1 | 43200 | < th | dose dependent | rect. | 4 | 13 |
| 746 | 233.23 | precipitation | 0.1 | 43200 | > th | dose dependent | rect. | 3 | 13 |
| 750 | 233.27 | precipitation | 0.1 | 43200 | > th | dose independent | rect. | 4 | 13 |
| 753 | 233.32 | precipitation | 0.1 | 43200 | > th | dose independent | rect. | 2 | 14 |
| 763 | 233.39 | precipitation | 0.1 | 43200 | < th | dose independent | sin | 3 | NA |
| 764 | 233.39 | precipitation | 0.1 | 43200 | < th | dose dependent | sin | 3 | NA |
| 765 | 233.40 | precipitation | 0.1 | 43200 | < th | dose independent | rect. | 2 | 14 |
| 766 | 233.40 | precipitation | 0.1 | 43200 | < th | dose dependent | rect. | 2 | 14 |
| 769 | 233.43 | precipitation | 0.1 | 43200 | > th | dose independent | sin | 3 | NA |
| 775 | 233.50 | precipitation | 0.1 | 43200 | > th | dose dependent | sin | 4 | NA |
| 864 | 234.14 | precipitation | 0.1 | 43200 | > th | dose independent | sin | 7 | NA |
| 865 | 234.14 | temperature | 25.0 | 14400 | > th | dose independent | rect. | 23 | 1 |
| 871 | 234.17 | precipitation | 0.1 | 43200 | < th | dose independent | sin | 7 | NA |
| 872 | 234.17 | precipitation | 0.1 | 43200 | < th | dose dependent | sin | 7 | NA |
| 878 | 234.23 | precipitation | 0.1 | 43200 | > th | dose independent | rect. | 22 | 16 |
| 879 | 234.24 | precipitation | 0.1 | 43200 | < th | dose independent | rect. | 22 | 16 |
| 880 | 234.24 | precipitation | 0.1 | 43200 | < th | dose dependent | rect. | 22 | 16 |
| 921 | 234.38 | precipitation | 0.1 | 43200 | > th | dose dependent | rect. | 22 | 14 |
| 973 | 234.60 | precipitation | 0.1 | 43200 | > th | dose dependent | rect. | 7 | 7 |