Os12g0150200
blastp(Os)/ blastp(At)/ coex/// RAP/ RiceXPro/ SALAD/ ATTED-II
Description : Cytochrome P450 family protein.

FiT-DB / Search/ Help/ Sample detail
|
Os12g0150200 |
blastp(Os)/ blastp(At)/ coex/// RAP/ RiceXPro/ SALAD/ ATTED-II |
|
Description : Cytochrome P450 family protein.
|
|
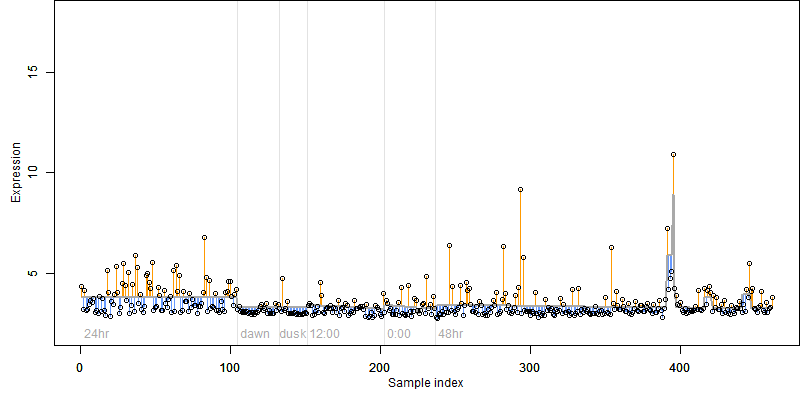
log2(Expression) ~ Norm(μ, σ2)
μ = α + β1D + β2C + β3E + β4D*C + β5D*E + γ1N8
|
_____ |
|
 __
__
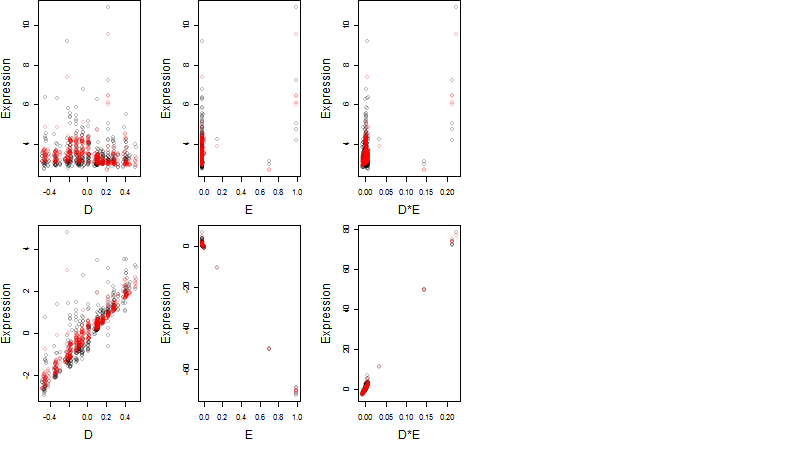
Dependence on each variable
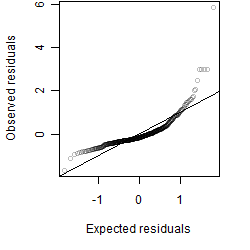
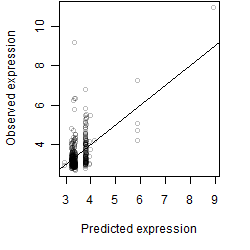
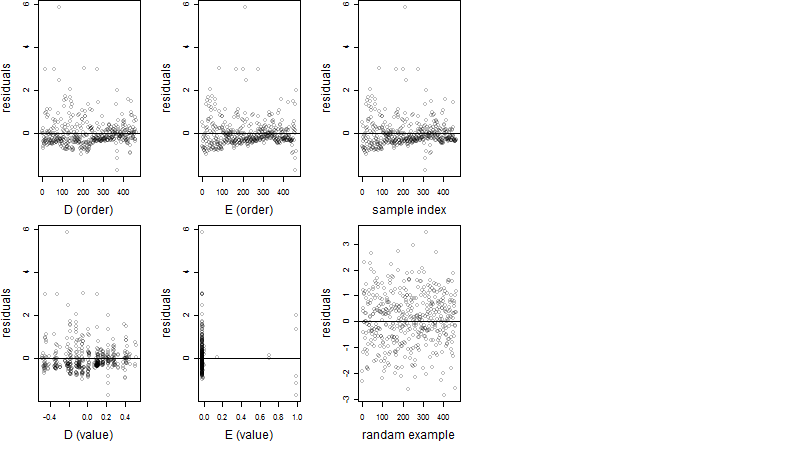
Residual plot
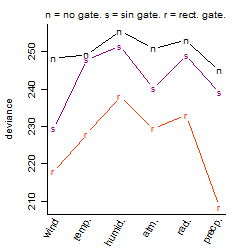
Process of the parameter reduction
(fixed parameters. wheather = precipitation,
response mode = > th, dose dependency = dose dependent, type of G = rect.)
| deviance | σ | α | β1 | β2 | β3 | β4 | β5 | γ1 | peak time of C | threshold | memory length | peak or start time of G | open length of G |
|---|---|---|---|---|---|---|---|---|---|---|---|---|---|
| 193.98 | 0.654 | 2.26 | 4.66 | 0.047 | -70.4 | -0.494 | 337 | 0.49 | 21.1 | 0.1133 | 642 | 17 | 0.996 |
| 2962.36 | 2.53 | 3.82 | -1.47 | 2.04 | -49.3 | 7.25 | -- | 0.539 | 20.9 | -0.004327 | 227 | 20.1 | 0.166 |
| 189.55 | 0.641 | 2.25 | 4.79 | 0.0729 | -70.9 | -- | 339 | 0.496 | 2.2 | 0.318 | 643 | 16.9 | 1.07 |
| 2389.92 | 2.28 | 3.53 | -0.94 | 1.98 | -44.9 | -- | -- | 0.605 | 20.8 | -0.005209 | 225 | 20.1 | 0.1 |
| 189.45 | 0.641 | 2.24 | 4.87 | -- | -71.9 | -- | 344 | 0.471 | -- | 0.3506 | 641 | 16.9 | 1.18 |
| 260.16 | 0.756 | 3.36 | 0.0443 | 0.21 | -- | 0.286 | -- | 0.443 | 23.2 | -- | -- | -- | -- |
| 260.5 | 0.756 | 3.36 | 0.0331 | 0.21 | -- | -- | -- | 0.442 | 23 | -- | -- | -- | -- |
| 1693.02 | 1.92 | 3.74 | 1.21 | -- | -36.1 | -- | -- | -0.866 | -- | 0.2963 | 108 | 20 | 0.217 |
| 260.93 | 0.752 | 3.36 | -- | 0.193 | -0.431 | -- | -- | 0.445 | 20.9 | 0.05836 | 131 | 20.3 | 0.0161 |
| 263.24 | 0.758 | 3.35 | 0.0377 | -- | -- | -- | -- | 0.443 | -- | -- | -- | -- | -- |
| 260.53 | 0.755 | 3.36 | -- | 0.21 | -- | -- | -- | 0.438 | 23 | -- | -- | -- | -- |
| 262.6 | 0.755 | 3.35 | -- | -- | 0.291 | -- | -- | 0.446 | -- | -0.1533 | 102 | 20.3 | 0.233 |
| 263.27 | 0.757 | 3.35 | -- | -- | -- | -- | -- | 0.439 | -- | -- | -- | -- | -- |
Results of the grid search
Summarized heatmap of deviance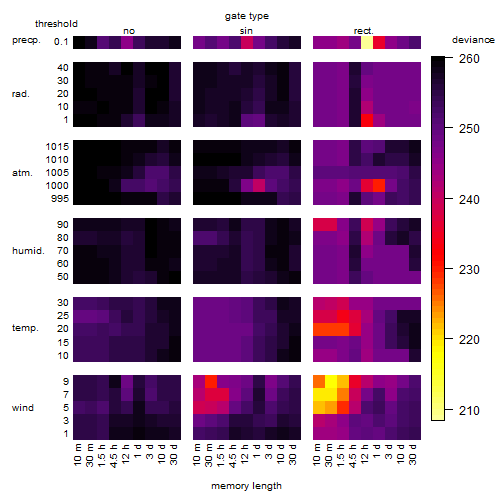
|
Histogram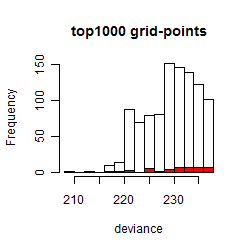 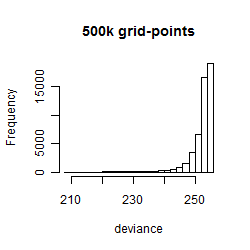
|
Local optima within top1000 grid-points
| rank | deviance | wheather | threshold | memory length | response mode | dose dependency | type of G | peak or start time of G | open length of G |
|---|---|---|---|---|---|---|---|---|---|
| 1 | 208.40 | precipitation | 0.1 | 720 | > th | dose dependent | rect. | 17 | 1 |
| 2 | 212.73 | precipitation | 0.1 | 720 | > th | dose independent | rect. | 17 | 1 |
| 3 | 218.00 | wind | 9.0 | 30 | > th | dose dependent | rect. | 18 | 8 |
| 13 | 219.25 | wind | 7.0 | 10 | > th | dose independent | rect. | 20 | 7 |
| 34 | 220.08 | wind | 9.0 | 30 | > th | dose dependent | rect. | 21 | 14 |
| 65 | 220.23 | wind | 9.0 | 30 | > th | dose dependent | rect. | 21 | 5 |
| 190 | 224.18 | wind | 9.0 | 30 | > th | dose dependent | rect. | 18 | 4 |
| 212 | 224.68 | wind | 9.0 | 90 | > th | dose independent | rect. | 18 | 4 |
| 236 | 225.48 | wind | 7.0 | 90 | > th | dose independent | rect. | 20 | 1 |
| 239 | 225.50 | precipitation | 0.1 | 720 | > th | dose dependent | rect. | 8 | 10 |
| 253 | 225.95 | wind | 7.0 | 90 | > th | dose dependent | rect. | 20 | 1 |
| 338 | 227.98 | temperature | 20.0 | 90 | < th | dose dependent | rect. | 1 | 1 |
| 347 | 228.32 | temperature | 20.0 | 10 | < th | dose dependent | rect. | 2 | 1 |
| 468 | 229.50 | wind | 9.0 | 30 | < th | dose independent | sin | 10 | NA |
| 472 | 229.57 | atmosphere | 1000.0 | 1440 | > th | dose independent | rect. | 2 | 1 |
| 477 | 229.58 | atmosphere | 1000.0 | 1440 | > th | dose independent | rect. | 2 | 3 |
| 501 | 230.20 | wind | 9.0 | 30 | > th | dose independent | sin | 10 | NA |
| 547 | 230.93 | precipitation | 0.1 | 720 | > th | dose dependent | rect. | 20 | 22 |
| 549 | 230.97 | atmosphere | 1000.0 | 1440 | < th | dose independent | rect. | 2 | 5 |
| 565 | 231.09 | precipitation | 0.1 | 720 | > th | dose independent | rect. | 8 | 10 |
| 571 | 231.17 | atmosphere | 1000.0 | 1440 | < th | dose independent | rect. | 2 | 3 |
| 584 | 231.31 | atmosphere | 1000.0 | 1440 | < th | dose dependent | rect. | 2 | 3 |
| 585 | 231.31 | atmosphere | 1000.0 | 1440 | < th | dose dependent | rect. | 2 | 5 |
| 698 | 232.94 | radiation | 1.0 | 720 | < th | dose independent | rect. | 17 | 9 |
| 705 | 233.08 | precipitation | 0.1 | 720 | < th | dose independent | rect. | 17 | 8 |
| 706 | 233.08 | precipitation | 0.1 | 720 | < th | dose dependent | rect. | 17 | 8 |
| 760 | 233.74 | atmosphere | 1000.0 | 1440 | > th | dose independent | rect. | 7 | 1 |
| 761 | 233.75 | temperature | 20.0 | 90 | < th | dose independent | rect. | 24 | 1 |
| 776 | 233.97 | radiation | 1.0 | 720 | < th | dose dependent | rect. | 17 | 1 |
| 778 | 234.07 | atmosphere | 1000.0 | 1440 | < th | dose dependent | rect. | 7 | 1 |
| 841 | 235.12 | precipitation | 0.1 | 1440 | < th | dose independent | rect. | 17 | 1 |
| 842 | 235.12 | precipitation | 0.1 | 1440 | < th | dose dependent | rect. | 17 | 1 |
| 884 | 235.85 | precipitation | 0.1 | 720 | > th | dose dependent | rect. | 17 | 10 |
| 886 | 235.87 | radiation | 1.0 | 720 | < th | dose independent | rect. | 17 | 1 |
| 894 | 235.96 | atmosphere | 1000.0 | 1440 | < th | dose dependent | rect. | 9 | 1 |
| 917 | 236.37 | atmosphere | 1000.0 | 720 | < th | dose dependent | rect. | 14 | 1 |
| 940 | 236.81 | wind | 7.0 | 30 | > th | dose dependent | sin | 10 | NA |
| 970 | 237.45 | precipitation | 0.1 | 720 | < th | dose independent | rect. | 11 | 8 |
| 972 | 237.45 | precipitation | 0.1 | 720 | < th | dose dependent | rect. | 11 | 8 |
| 989 | 237.66 | radiation | 1.0 | 720 | < th | dose dependent | rect. | 17 | 9 |
| 996 | 237.75 | temperature | 25.0 | 90 | < th | dose dependent | rect. | 24 | 5 |