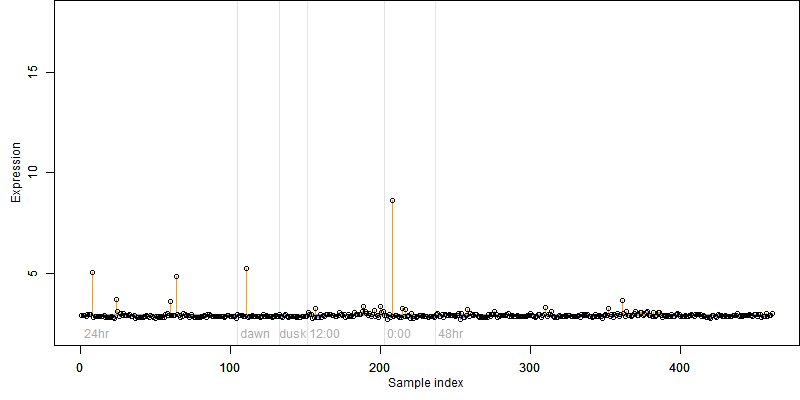
Os11g0656500
blastp(Os)/ blastp(At)/ coex/// RAP/ RiceXPro/ SALAD/ ATTED-II
Description : Reverse transcriptase, RNA-dependent DNA polymerase family protein.

FiT-DB / Search/ Help/ Sample detail
|
Os11g0656500 |
blastp(Os)/ blastp(At)/ coex/// RAP/ RiceXPro/ SALAD/ ATTED-II |
|
Description : Reverse transcriptase, RNA-dependent DNA polymerase family protein.
|
|
log2(Expression) ~ Norm(μ, σ2)
μ = α + β1D + β2C + β3E + β4D*C + β5D*E + γ1N8
|
_____ |
|
 __
__
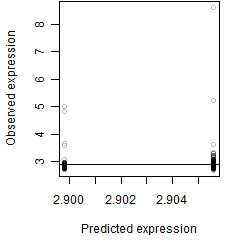
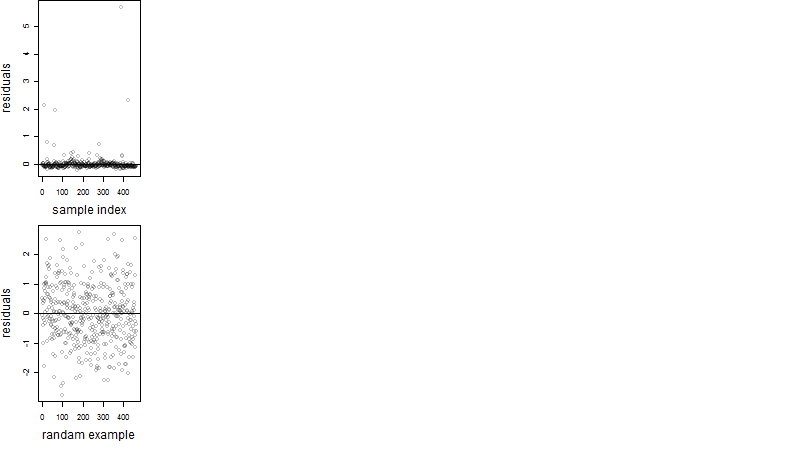
Dependence on each variable

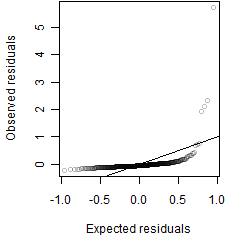
Residual plot
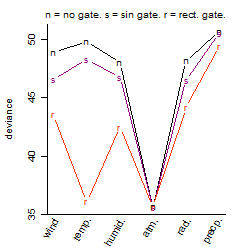
Process of the parameter reduction
(fixed parameters. wheather = atmosphere,
response mode = > th, dose dependency = dose dependent, type of G = no)
| deviance | σ | α | β1 | β2 | β3 | β4 | β5 | γ1 | peak time of C | threshold | memory length | peak or start time of G | open length of G |
|---|---|---|---|---|---|---|---|---|---|---|---|---|---|
| 35.63 | 0.278 | 2.9 | -0.0213 | 0.061 | 1.53 | 0.0839 | -3.99 | 0.0112 | 9.53 | 1015 | 10 | -- | -- |
| 42.33 | 0.305 | 2.9 | -0.0723 | 0.0565 | 1.57 | 0.342 | -- | 0.00337 | 11.1 | 1015 | 10 | -- | -- |
| 35.65 | 0.28 | 2.9 | -0.0154 | 0.0615 | 1.46 | -- | -3.9 | 0.0112 | 9.14 | 1015 | 10 | -- | -- |
| 39.11 | 0.291 | 2.9 | -0.00456 | 0.0807 | 1.73 | -- | -- | -0.026 | 11.6 | 1016 | 2 | -- | -- |
| 35.87 | 0.28 | 2.9 | -0.0157 | -- | 1.44 | -- | -3.9 | 0.0112 | -- | 1015 | 10 | -- | -- |
| 50.8 | 0.334 | 2.91 | -0.0796 | 0.00533 | -- | -0.352 | -- | -0.0149 | 0.514 | -- | -- | -- | -- |
| 51.25 | 0.335 | 2.91 | -0.0672 | 0.0415 | -- | -- | -- | -0.0141 | 5.84 | -- | -- | -- | -- |
| 37.7 | 0.286 | 2.9 | -0.0183 | -- | 2.49 | -- | -- | 0.0108 | -- | 1016 | 2 | -- | -- |
| 37.46 | 0.285 | 2.9 | -- | 0.0853 | 2.52 | -- | -- | 0.00134 | 9.84 | 1016 | 2 | -- | -- |
| 51.34 | 0.335 | 2.91 | -0.0659 | -- | -- | -- | -- | -0.0131 | -- | -- | -- | -- | -- |
| 51.37 | 0.335 | 2.9 | -- | 0.0404 | -- | -- | -- | -0.00658 | 5.92 | -- | -- | -- | -- |
| 37.71 | 0.286 | 2.9 | -- | -- | 2.5 | -- | -- | 0.0129 | -- | 1016 | 2 | -- | -- |
| 51.45 | 0.335 | 2.91 | -- | -- | -- | -- | -- | -0.00578 | -- | -- | -- | -- | -- |
Results of the grid search
Summarized heatmap of deviance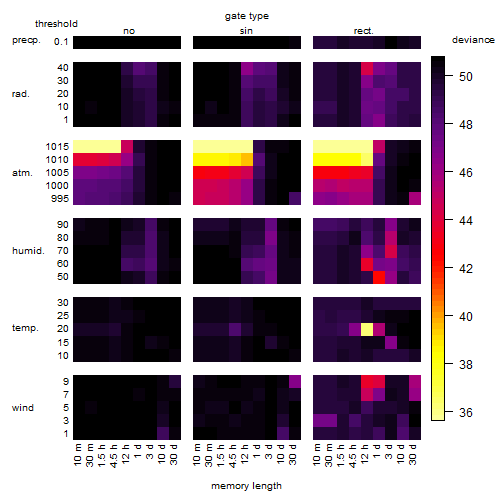
|
Histogram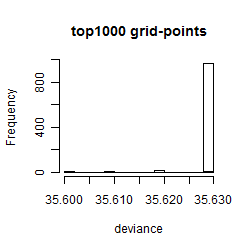 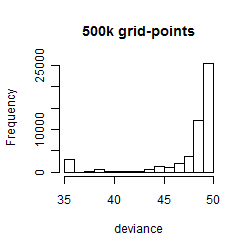
|
Local optima within top1000 grid-points
| rank | deviance | wheather | threshold | memory length | response mode | dose dependency | type of G | peak or start time of G | open length of G |
|---|---|---|---|---|---|---|---|---|---|
| 1 | 35.60 | atmosphere | 1015 | 10 | < th | dose independent | sin | 13 | NA |
| 4 | 35.60 | atmosphere | 1015 | 270 | < th | dose independent | sin | 16 | NA |
| 5 | 35.60 | atmosphere | 1015 | 10 | < th | dose independent | sin | 1 | NA |
| 8 | 35.60 | atmosphere | 1015 | 270 | < th | dose independent | sin | 4 | NA |
| 30 | 35.62 | atmosphere | 1015 | 720 | > th | dose independent | rect. | 22 | 1 |
| 33 | 35.63 | atmosphere | 1015 | 10 | > th | dose independent | sin | 7 | NA |
| 129 | 35.63 | atmosphere | 1015 | 10 | > th | dose independent | no | NA | NA |
| 137 | 35.63 | atmosphere | 1015 | 10 | < th | dose independent | no | NA | NA |
| 147 | 35.63 | atmosphere | 1015 | 10 | > th | dose independent | rect. | 23 | 1 |