Os11g0609500
blastp(Os)/ blastp(At)/ coex/// RAP/ RiceXPro/ SALAD/ ATTED-II
Description :
FiT-DB / Search/ Help/ Sample detail
|
Os11g0609500 |
blastp(Os)/ blastp(At)/ coex/// RAP/ RiceXPro/ SALAD/ ATTED-II |
|
Description :
|
|
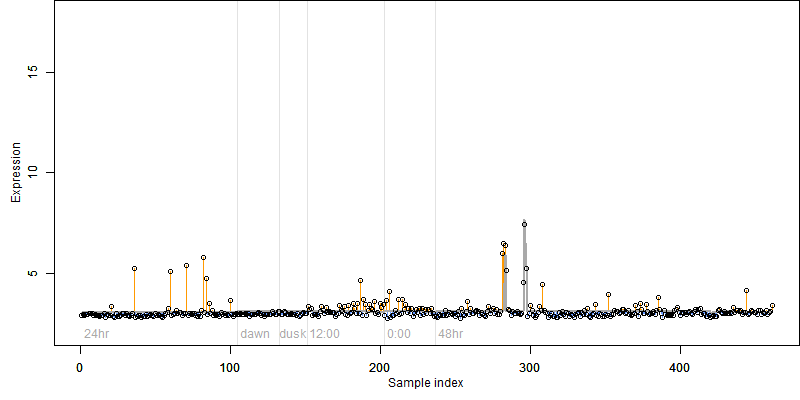
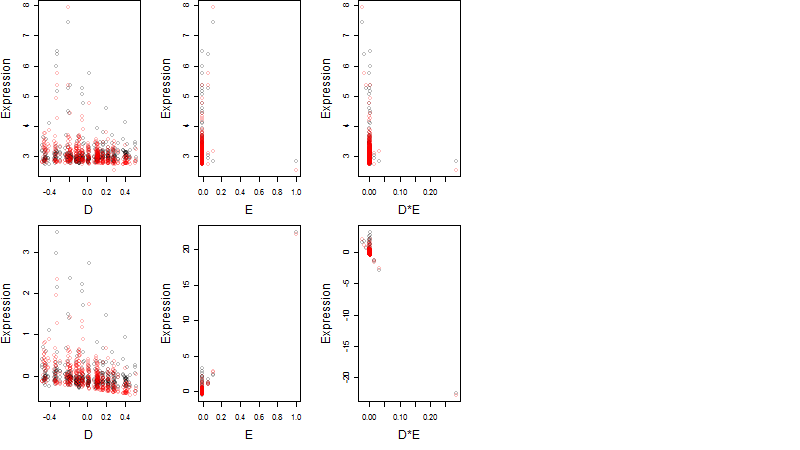
log2(Expression) ~ Norm(μ, σ2)
μ = α + β1D + β2C + β3E + β4D*C + β5D*E + γ1N8
|
_____ |
|
 __
__

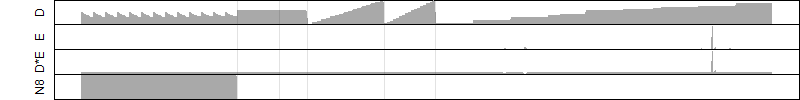
Dependence on each variable
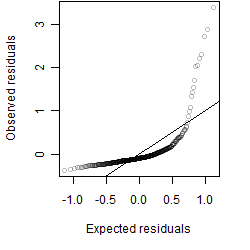
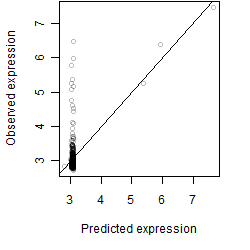
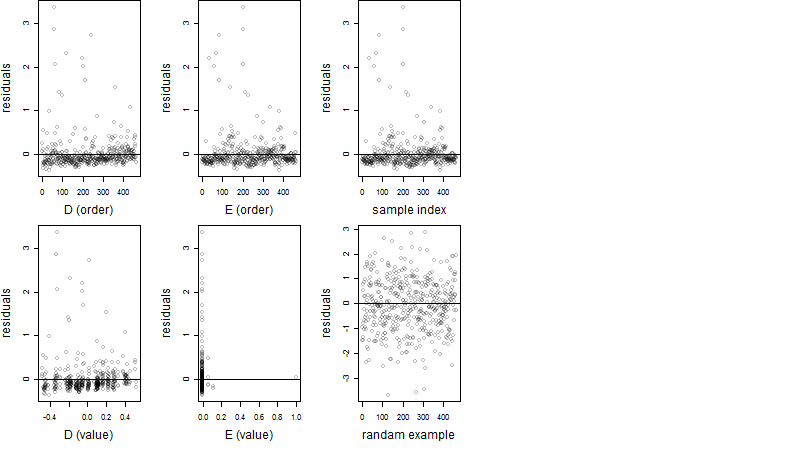
Residual plot
Process of the parameter reduction
(fixed parameters. wheather = precipitation,
response mode = > th, dose dependency = dose independent, type of G = rect.)
| deviance | σ | α | β1 | β2 | β3 | β4 | β5 | γ1 | peak time of C | threshold | memory length | peak or start time of G | open length of G |
|---|---|---|---|---|---|---|---|---|---|---|---|---|---|
| 68.64 | 0.386 | 3.15 | -0.333 | 0.123 | 22.8 | -0.842 | -79.8 | -0.0449 | 2.68 | 0.1 | 30 | 3 | 5 |
| 98.47 | 0.466 | 3.11 | -0.192 | 0.209 | -0.132 | -1.23 | -- | -0.0856 | 3.44 | 0.1 | 30 | 3 | 5 |
| 71.05 | 0.393 | 3.15 | -0.315 | 0.125 | 22.1 | -- | -78 | -0.0407 | 3.48 | 0.1487 | 29 | 2.96 | 14.4 |
| 102.84 | 0.472 | 3.11 | -0.175 | 0.199 | 0.655 | -- | -- | -0.0739 | 3.81 | 0.0004579 | 26 | 3.17 | 4.21 |
| 71.9 | 0.395 | 3.15 | -0.313 | -- | 22.5 | -- | -79 | -0.0353 | -- | 0.1555 | 29 | 2.95 | 14.6 |
| 98.49 | 0.465 | 3.11 | -0.193 | 0.208 | -- | -1.24 | -- | -0.0853 | 3.45 | -- | -- | -- | -- |
| 103.26 | 0.476 | 3.11 | -0.171 | 0.206 | -- | -- | -- | -0.0783 | 3.87 | -- | -- | -- | -- |
| 104.98 | 0.477 | 3.11 | -0.168 | -- | 0.765 | -- | -- | -0.0705 | -- | 0.1494 | 26 | 3.14 | 4.27 |
| 103.65 | 0.474 | 3.1 | -- | 0.194 | 0.608 | -- | -- | -0.0573 | 3.86 | 0.2046 | 26 | 3.25 | 4.38 |
| 105.58 | 0.48 | 3.11 | -0.162 | -- | -- | -- | -- | -0.0728 | -- | -- | -- | -- | -- |
| 104.03 | 0.477 | 3.1 | -- | 0.202 | -- | -- | -- | -0.0592 | 3.88 | -- | -- | -- | -- |
| 105.72 | 0.479 | 3.1 | -- | -- | 0.732 | -- | -- | -0.0519 | -- | 0.2336 | 26 | 3.21 | 4.37 |
| 106.28 | 0.481 | 3.1 | -- | -- | -- | -- | -- | -0.0547 | -- | -- | -- | -- | -- |
Results of the grid search
Summarized heatmap of deviance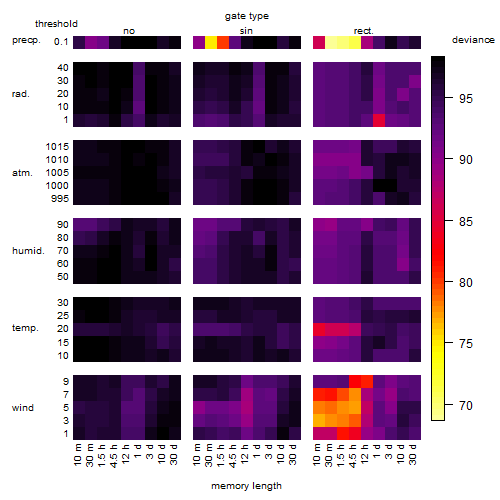
|
Histogram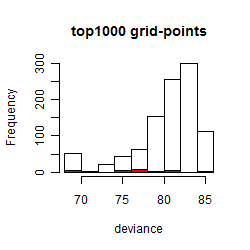 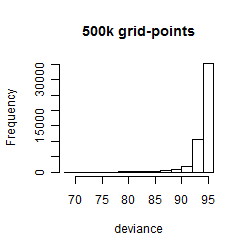
|
Local optima within top1000 grid-points
| rank | deviance | wheather | threshold | memory length | response mode | dose dependency | type of G | peak or start time of G | open length of G |
|---|---|---|---|---|---|---|---|---|---|
| 1 | 68.64 | precipitation | 0.1 | 30 | > th | dose independent | rect. | 3 | 5 |
| 13 | 68.64 | precipitation | 0.1 | 30 | > th | dose dependent | rect. | 3 | 5 |
| 25 | 68.65 | precipitation | 0.1 | 30 | > th | dose independent | rect. | 3 | 3 |
| 37 | 68.65 | precipitation | 0.1 | 30 | > th | dose dependent | rect. | 3 | 3 |
| 89 | 75.10 | precipitation | 0.1 | 30 | > th | dose independent | sin | 3 | NA |
| 90 | 75.11 | precipitation | 0.1 | 30 | > th | dose dependent | sin | 3 | NA |
| 91 | 75.16 | precipitation | 0.1 | 30 | < th | dose independent | sin | 3 | NA |
| 92 | 75.16 | precipitation | 0.1 | 30 | < th | dose dependent | sin | 3 | NA |
| 131 | 76.80 | wind | 3.0 | 10 | > th | dose dependent | rect. | 2 | 4 |
| 161 | 77.46 | wind | 5.0 | 270 | > th | dose dependent | rect. | 1 | 2 |
| 162 | 77.50 | wind | 5.0 | 90 | > th | dose dependent | rect. | 2 | 4 |
| 164 | 77.62 | wind | 7.0 | 270 | > th | dose independent | rect. | 24 | 4 |
| 169 | 77.77 | wind | 5.0 | 270 | > th | dose dependent | rect. | 24 | 4 |
| 170 | 77.79 | wind | 5.0 | 90 | > th | dose dependent | rect. | 3 | 2 |
| 171 | 77.83 | wind | 5.0 | 270 | > th | dose independent | rect. | 1 | 2 |
| 173 | 77.85 | wind | 5.0 | 90 | > th | dose independent | rect. | 3 | 2 |
| 184 | 78.17 | wind | 5.0 | 10 | > th | dose independent | rect. | 2 | 4 |
| 386 | 80.80 | wind | 9.0 | 720 | > th | dose independent | rect. | 19 | 1 |
| 387 | 80.80 | wind | 9.0 | 720 | > th | dose dependent | rect. | 19 | 1 |
| 389 | 80.84 | wind | 7.0 | 10 | > th | dose independent | rect. | 20 | 9 |
| 400 | 80.85 | wind | 7.0 | 10 | > th | dose dependent | rect. | 21 | 8 |
| 500 | 81.74 | wind | 3.0 | 10 | > th | dose independent | rect. | 3 | 1 |
| 912 | 84.31 | temperature | 20.0 | 10 | > th | dose independent | rect. | 3 | 1 |
| 937 | 84.58 | radiation | 1.0 | 1440 | < th | dose independent | rect. | 11 | 1 |
| 939 | 84.58 | radiation | 1.0 | 1440 | < th | dose dependent | rect. | 11 | 1 |