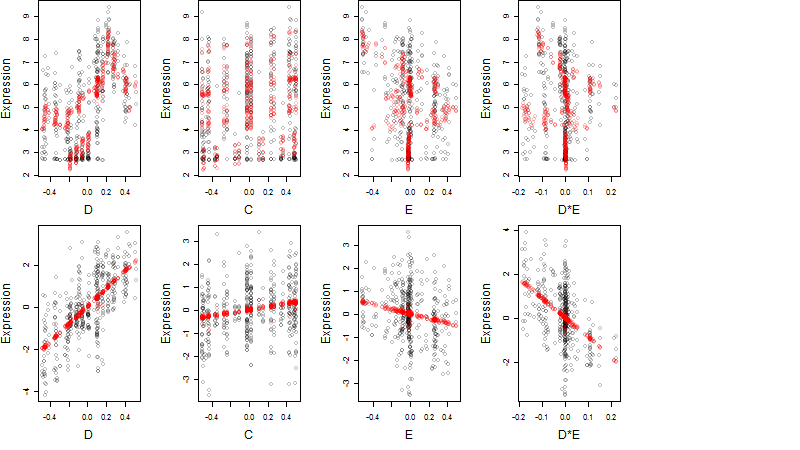
Os11g0539500
blastp(Os)/ blastp(At)/ coex/// RAP/ RiceXPro/ SALAD/ ATTED-II
Description : Winged helix repressor DNA-binding domain containing protein.

FiT-DB / Search/ Help/ Sample detail
|
Os11g0539500 |
blastp(Os)/ blastp(At)/ coex/// RAP/ RiceXPro/ SALAD/ ATTED-II |
|
Description : Winged helix repressor DNA-binding domain containing protein.
|
|
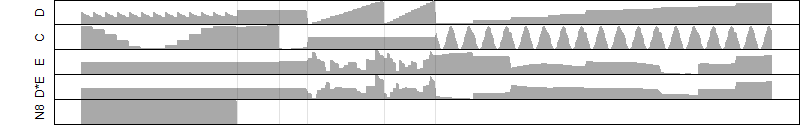
log2(Expression) ~ Norm(μ, σ2)
μ = α + β1D + β2C + β3E + β4D*C + β5D*E + γ1N8
|
_____ |
|

 __
__

Dependence on each variable
Residual plot

Process of the parameter reduction
(fixed parameters. wheather = atmosphere,
response mode = > th, dose dependency = dose dependent, type of G = no)
| deviance | σ | α | β1 | β2 | β3 | β4 | β5 | γ1 | peak time of C | threshold | memory length | peak or start time of G | open length of G |
|---|---|---|---|---|---|---|---|---|---|---|---|---|---|
| 578.13 | 1.13 | 5.44 | 4.1 | 0.676 | -1.12 | 1.82 | -8.2 | -2.07 | 6.4 | 995.3 | 14581 | -- | -- |
| 663.01 | 1.2 | 5.63 | 2.58 | 0.687 | -1.93 | 2.47 | -- | -2.41 | 6.04 | 996.3 | 12271 | -- | -- |
| 584.96 | 1.13 | 5.45 | 4.2 | 0.669 | -1.01 | -- | -8.95 | -2.07 | 5.86 | 993.4 | 15876 | -- | -- |
| 667.77 | 1.2 | 5.62 | 2.56 | 0.715 | -1.92 | -- | -- | -2.37 | 5.61 | 995.5 | 12268 | -- | -- |
| 608.37 | 1.15 | 5.46 | 4.24 | -- | -1 | -- | -9.05 | -2.05 | -- | 993.3 | 15886 | -- | -- |
| 731.03 | 1.27 | 5.61 | 2.97 | 0.687 | -- | 1.76 | -- | -2.33 | 6.26 | -- | -- | -- | -- |
| 737.93 | 1.27 | 5.62 | 2.98 | 0.705 | -- | -- | -- | -2.34 | 5.67 | -- | -- | -- | -- |
| 693.48 | 1.23 | 5.63 | 2.58 | -- | -1.91 | -- | -- | -2.33 | -- | 994.8 | 11549 | -- | -- |
| 717.31 | 1.25 | 5.81 | -- | 0.695 | -3.04 | -- | -- | -3.18 | 5.75 | 989.2 | 47520 | -- | -- |
| 763.73 | 1.29 | 5.63 | 3.01 | -- | -- | -- | -- | -2.32 | -- | -- | -- | -- | -- |
| 972.4 | 1.46 | 5.69 | -- | 0.753 | -- | -- | -- | -2.67 | 5.5 | -- | -- | -- | -- |
| 742.35 | 1.27 | 5.82 | -- | -- | -3.07 | -- | -- | -3.17 | -- | 983.1 | 47520 | -- | -- |
| 1001.94 | 1.48 | 5.7 | -- | -- | -- | -- | -- | -2.65 | -- | -- | -- | -- | -- |
Results of the grid search
Summarized heatmap of deviance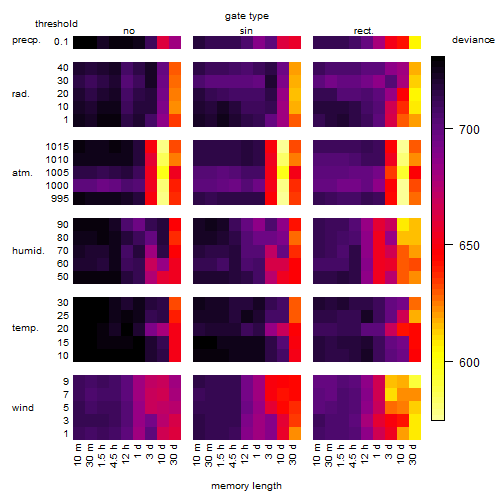
|
Histogram 
|
Local optima within top1000 grid-points
| rank | deviance | wheather | threshold | memory length | response mode | dose dependency | type of G | peak or start time of G | open length of G |
|---|---|---|---|---|---|---|---|---|---|
| 1 | 574.51 | atmosphere | 1015 | 14400 | < th | dose dependent | rect. | 4 | 1 |
| 3 | 574.76 | atmosphere | 995 | 14400 | > th | dose dependent | rect. | 4 | 1 |
| 41 | 575.49 | atmosphere | 1015 | 14400 | < th | dose dependent | rect. | 23 | 9 |
| 75 | 575.68 | atmosphere | 995 | 14400 | > th | dose dependent | rect. | 23 | 9 |
| 138 | 576.06 | atmosphere | 1015 | 14400 | < th | dose dependent | sin | 7 | NA |
| 172 | 576.23 | atmosphere | 995 | 14400 | > th | dose dependent | sin | 7 | NA |
| 241 | 576.62 | atmosphere | 1015 | 14400 | < th | dose dependent | rect. | 10 | 1 |
| 255 | 576.69 | atmosphere | 995 | 14400 | > th | dose dependent | rect. | 10 | 1 |
| 379 | 577.18 | atmosphere | 1015 | 14400 | < th | dose dependent | rect. | 23 | 2 |
| 441 | 577.41 | atmosphere | 995 | 14400 | > th | dose dependent | rect. | 23 | 2 |
| 659 | 578.20 | atmosphere | 1015 | 14400 | < th | dose dependent | no | NA | NA |
| 680 | 578.25 | atmosphere | 1015 | 14400 | < th | dose dependent | rect. | 1 | 23 |
| 703 | 578.31 | atmosphere | 1015 | 14400 | < th | dose dependent | rect. | 10 | 23 |
| 728 | 578.38 | atmosphere | 995 | 14400 | > th | dose dependent | no | NA | NA |
| 741 | 578.42 | atmosphere | 995 | 14400 | > th | dose dependent | rect. | 1 | 23 |
| 770 | 578.49 | atmosphere | 995 | 14400 | > th | dose dependent | rect. | 10 | 23 |