Os11g0514500
blastp(Os)/ blastp(At)/ coex/// RAP/ RiceXPro/ SALAD/ ATTED-II
Description : Similar to Leucine-rich repeat-containing extracellular glycoprotein precursor.
FiT-DB / Search/ Help/ Sample detail
|
Os11g0514500 |
blastp(Os)/ blastp(At)/ coex/// RAP/ RiceXPro/ SALAD/ ATTED-II |
|
Description : Similar to Leucine-rich repeat-containing extracellular glycoprotein precursor.
|
|
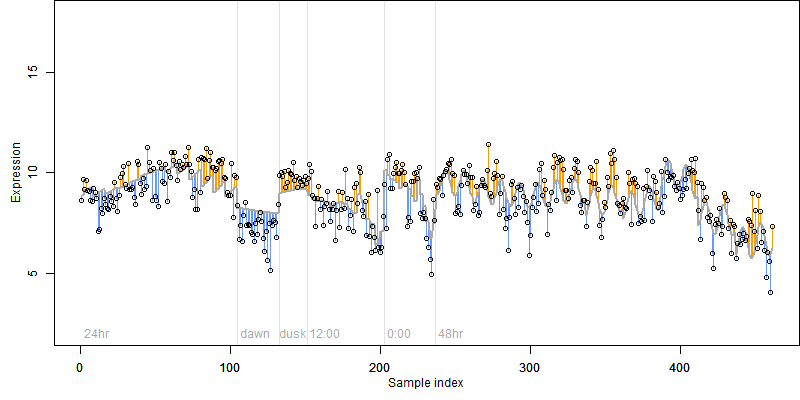
log2(Expression) ~ Norm(μ, σ2)
μ = α + β1D + β2C + β3E + β4D*C + β5D*E + γ1N8
|
_____ |
|

 __
__

Dependence on each variable
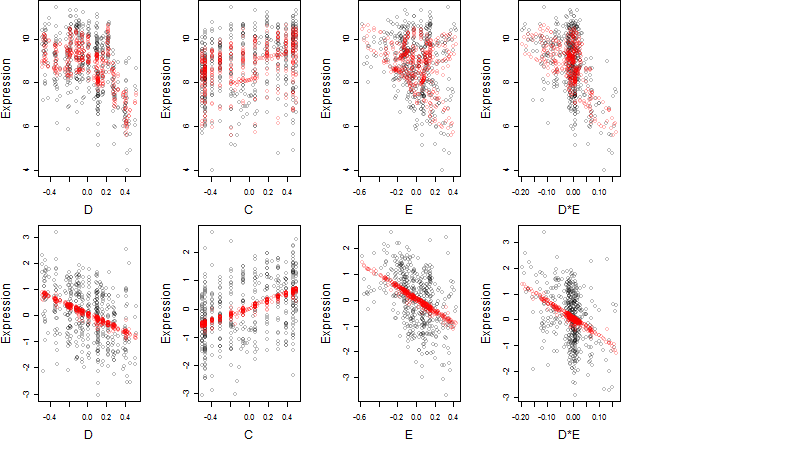
Residual plot

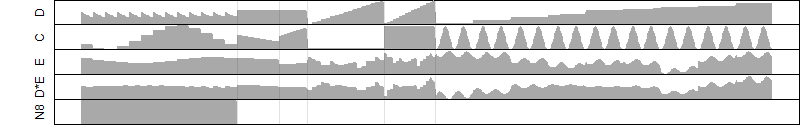
Process of the parameter reduction
(fixed parameters. wheather = atmosphere,
response mode = > th, dose dependency = dose dependent, type of G = sin)
| deviance | σ | α | β1 | β2 | β3 | β4 | β5 | γ1 | peak time of C | threshold | memory length | peak or start time of G | open length of G |
|---|---|---|---|---|---|---|---|---|---|---|---|---|---|
| 418.21 | 0.961 | 8.59 | -1.71 | 0.906 | -2.35 | -0.916 | -6.02 | 0.877 | 22.4 | 969.9 | 10760 | 5.74 | -- |
| 434.83 | 0.971 | 8.59 | -2.63 | 0.815 | -3.83 | -2.98 | -- | 0.965 | 4.02 | 914.7 | 10718 | 4.39 | -- |
| 415.36 | 0.949 | 8.56 | -1.63 | 1.23 | -2.38 | -- | -6.65 | 0.927 | 22.5 | 960.2 | 10723 | 7.53 | -- |
| 450.62 | 0.989 | 8.71 | -2.62 | 1.34 | -2.5 | -- | -- | 0.685 | 21.5 | 939.6 | 11397 | 15 | -- |
| 452.75 | 0.991 | 8.57 | -1.74 | -- | -2.95 | -- | -6.42 | 0.884 | -- | 894.7 | 8384 | 8.45 | -- |
| 550.28 | 1.1 | 8.7 | -2.03 | 1.26 | -- | 0.495 | -- | 0.733 | 20.5 | -- | -- | -- | -- |
| 550.89 | 1.1 | 8.7 | -2.05 | 1.25 | -- | -- | -- | 0.732 | 20.7 | -- | -- | -- | -- |
| 466.57 | 1.01 | 8.68 | -2.64 | -- | -3.33 | -- | -- | 0.717 | -- | 897.3 | 9796 | 7.45 | -- |
| 610.66 | 1.15 | 8.65 | -- | 1.29 | -1.6 | -- | -- | 0.983 | 20.8 | 901 | 11484 | 16.6 | -- |
| 639.24 | 1.18 | 8.67 | -2.05 | -- | -- | -- | -- | 0.721 | -- | -- | -- | -- | -- |
| 661.51 | 1.2 | 8.65 | -- | 1.26 | -- | -- | -- | 0.96 | 20.6 | -- | -- | -- | -- |
| 612.67 | 1.15 | 8.63 | -- | -- | -2.73 | -- | -- | 1.02 | -- | 783.3 | 11765 | 23.5 | -- |
| 750.26 | 1.28 | 8.61 | -- | -- | -- | -- | -- | 0.949 | -- | -- | -- | -- | -- |
Results of the grid search
Summarized heatmap of deviance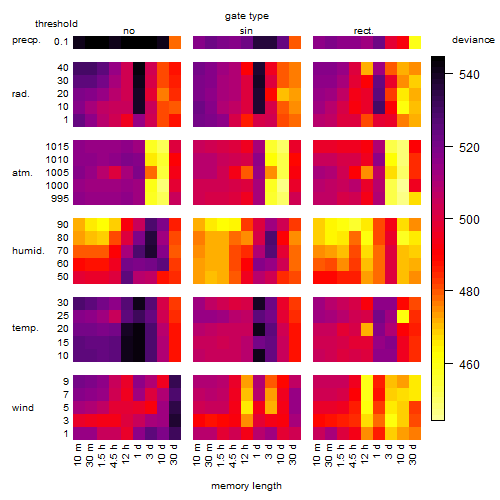
|
Histogram 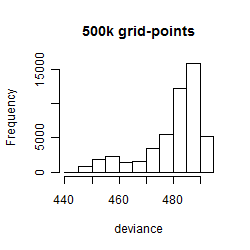
|
Local optima within top1000 grid-points
| rank | deviance | wheather | threshold | memory length | response mode | dose dependency | type of G | peak or start time of G | open length of G |
|---|---|---|---|---|---|---|---|---|---|
| 1 | 444.11 | atmosphere | 1000 | 14400 | > th | dose dependent | rect. | 23 | 1 |
| 19 | 446.31 | atmosphere | 1000 | 14400 | > th | dose dependent | rect. | 19 | 9 |
| 39 | 446.65 | atmosphere | 1000 | 14400 | > th | dose dependent | rect. | 3 | 1 |
| 71 | 447.08 | atmosphere | 1000 | 14400 | > th | dose dependent | sin | 13 | NA |
| 88 | 447.23 | atmosphere | 1000 | 14400 | > th | dose dependent | rect. | 1 | 1 |
| 97 | 447.36 | atmosphere | 1015 | 14400 | < th | dose dependent | rect. | 23 | 1 |
| 136 | 447.77 | atmosphere | 1000 | 14400 | > th | dose dependent | rect. | 1 | 3 |
| 163 | 447.96 | atmosphere | 1010 | 14400 | > th | dose independent | rect. | 21 | 1 |
| 222 | 448.19 | atmosphere | 1015 | 14400 | < th | dose dependent | rect. | 19 | 5 |
| 244 | 448.28 | atmosphere | 1015 | 14400 | < th | dose dependent | rect. | 20 | 1 |
| 251 | 448.30 | atmosphere | 1000 | 14400 | > th | dose dependent | rect. | 19 | 21 |
| 257 | 448.31 | atmosphere | 1000 | 14400 | > th | dose dependent | rect. | 3 | 23 |
| 275 | 448.34 | atmosphere | 1000 | 14400 | > th | dose dependent | no | NA | NA |
| 277 | 448.34 | atmosphere | 1000 | 14400 | > th | dose dependent | rect. | 5 | 23 |
| 283 | 448.37 | atmosphere | 1000 | 14400 | > th | dose dependent | rect. | 1 | 23 |
| 293 | 448.41 | atmosphere | 1015 | 14400 | < th | dose dependent | rect. | 19 | 7 |
| 343 | 448.57 | atmosphere | 1000 | 14400 | > th | dose dependent | rect. | 5 | 1 |
| 370 | 448.68 | atmosphere | 1015 | 14400 | < th | dose dependent | rect. | 19 | 9 |
| 497 | 449.16 | atmosphere | 1015 | 14400 | < th | dose dependent | rect. | 3 | 1 |
| 534 | 449.32 | atmosphere | 1015 | 14400 | < th | dose dependent | rect. | 1 | 1 |
| 584 | 449.47 | atmosphere | 1015 | 14400 | < th | dose dependent | sin | 13 | NA |
| 598 | 449.51 | atmosphere | 1010 | 14400 | < th | dose independent | rect. | 21 | 1 |
| 725 | 449.92 | atmosphere | 1015 | 14400 | < th | dose dependent | rect. | 1 | 3 |
| 728 | 449.93 | atmosphere | 1000 | 14400 | > th | dose dependent | rect. | 15 | 1 |
| 756 | 449.98 | atmosphere | 1000 | 14400 | > th | dose dependent | rect. | 11 | 1 |
| 892 | 450.33 | atmosphere | 1015 | 14400 | < th | dose dependent | rect. | 3 | 3 |
| 925 | 450.42 | atmosphere | 1015 | 14400 | < th | dose dependent | rect. | 5 | 1 |