Os11g0176300
blastp(Os)/ blastp(At)/ coex/// RAP/ RiceXPro/ SALAD/ ATTED-II
Description : Protein of unknown function DUF246, plant family protein.

FiT-DB / Search/ Help/ Sample detail
|
Os11g0176300 |
blastp(Os)/ blastp(At)/ coex/// RAP/ RiceXPro/ SALAD/ ATTED-II |
|
Description : Protein of unknown function DUF246, plant family protein.
|
|
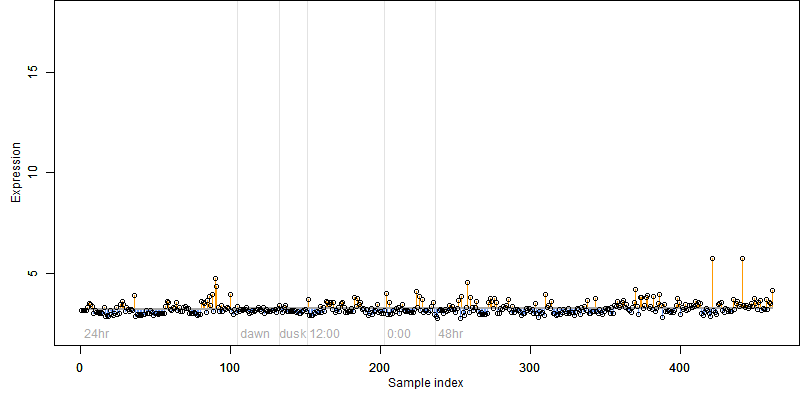
log2(Expression) ~ Norm(μ, σ2)
μ = α + β1D + β2C + β3E + β4D*C + β5D*E + γ1N8
|
_____ |
|

 __
__

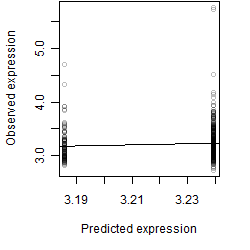
Dependence on each variable

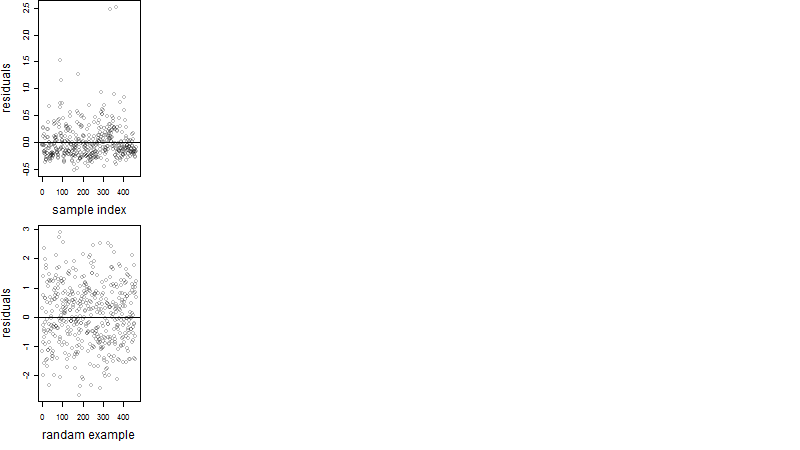
Residual plot
Process of the parameter reduction
(fixed parameters. wheather = precipitation,
response mode = > th, dose dependency = dose dependent, type of G = no)
| deviance | σ | α | β1 | β2 | β3 | β4 | β5 | γ1 | peak time of C | threshold | memory length | peak or start time of G | open length of G |
|---|---|---|---|---|---|---|---|---|---|---|---|---|---|
| 37.95 | 0.289 | 3.23 | 0.147 | 0.133 | 0.34 | -0.274 | 7.37 | -0.0335 | 6.78 | 0.3817 | 10 | -- | -- |
| 37.94 | 0.287 | 3.23 | 0.141 | 0.126 | 2.42 | -0.213 | -- | -0.0249 | 7.18 | 0.2602 | 5 | -- | -- |
| 38.11 | 0.288 | 3.22 | 0.144 | 0.133 | 0.377 | -- | 7.23 | -0.0334 | 7.52 | 0.3717 | 9 | -- | -- |
| 38.08 | 0.287 | 3.23 | 0.137 | 0.124 | 2.43 | -- | -- | -0.0326 | 7.73 | 0.2108 | 5 | -- | -- |
| 38.99 | 0.291 | 3.23 | 0.142 | -- | 1.01 | -- | 5.14 | -0.0297 | -- | 0.3739 | 6 | -- | -- |
| 44.25 | 0.312 | 3.23 | 0.167 | 0.14 | -- | -0.233 | -- | -0.0384 | 6.76 | -- | -- | -- | -- |
| 44.39 | 0.312 | 3.23 | 0.163 | 0.139 | -- | -- | -- | -0.0376 | 6.97 | -- | -- | -- | -- |
| 38.93 | 0.291 | 3.23 | 0.133 | -- | 2.49 | -- | -- | -0.0269 | -- | 0.2672 | 5 | -- | -- |
| 38.52 | 0.289 | 3.23 | -- | 0.128 | 2.49 | -- | -- | -0.0428 | 7.55 | 0.2024 | 5 | -- | -- |
| 45.4 | 0.315 | 3.24 | 0.166 | -- | -- | -- | -- | -0.0351 | -- | -- | -- | -- | -- |
| 45.09 | 0.314 | 3.24 | -- | 0.141 | -- | -- | -- | -0.0558 | 6.9 | -- | -- | -- | -- |
| 39.4 | 0.292 | 3.24 | -- | -- | 2.52 | -- | -- | -0.0412 | -- | 0.241 | 5 | -- | -- |
| 46.12 | 0.317 | 3.24 | -- | -- | -- | -- | -- | -0.0535 | -- | -- | -- | -- | -- |
Results of the grid search
Summarized heatmap of deviance
|
Histogram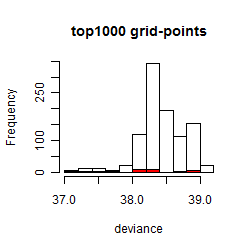 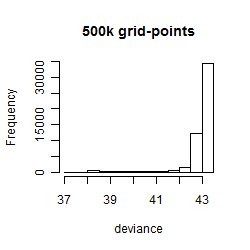
|
Local optima within top1000 grid-points
| rank | deviance | wheather | threshold | memory length | response mode | dose dependency | type of G | peak or start time of G | open length of G |
|---|---|---|---|---|---|---|---|---|---|
| 1 | 37.17 | precipitation | 0.1 | 10 | > th | dose independent | rect. | 3 | 15 |
| 9 | 37.38 | precipitation | 0.1 | 10 | > th | dose dependent | rect. | 3 | 15 |
| 17 | 37.46 | precipitation | 0.1 | 10 | > th | dose dependent | sin | 0 | NA |
| 20 | 37.51 | precipitation | 0.1 | 10 | > th | dose dependent | rect. | 23 | 19 |
| 29 | 37.68 | precipitation | 0.1 | 10 | > th | dose independent | sin | 1 | NA |
| 65 | 38.09 | precipitation | 0.1 | 10 | < th | dose independent | sin | 1 | NA |
| 66 | 38.09 | humidity | 90.0 | 10 | > th | dose independent | rect. | 17 | 1 |
| 76 | 38.09 | precipitation | 0.1 | 10 | < th | dose dependent | sin | 1 | NA |
| 77 | 38.09 | humidity | 90.0 | 10 | > th | dose dependent | rect. | 17 | 1 |
| 87 | 38.11 | precipitation | 0.1 | 10 | > th | dose independent | rect. | 17 | 1 |
| 115 | 38.11 | precipitation | 0.1 | 10 | > th | dose dependent | rect. | 17 | 1 |
| 145 | 38.12 | wind | 3.0 | 10 | > th | dose independent | rect. | 4 | 1 |
| 147 | 38.12 | wind | 3.0 | 10 | > th | dose dependent | rect. | 4 | 1 |
| 165 | 38.20 | precipitation | 0.1 | 30 | > th | dose dependent | rect. | 3 | 1 |
| 175 | 38.21 | precipitation | 0.1 | 10 | > th | dose independent | rect. | 3 | 1 |
| 176 | 38.21 | precipitation | 0.1 | 90 | > th | dose independent | rect. | 4 | 1 |
| 222 | 38.25 | precipitation | 0.1 | 10 | > th | dose dependent | rect. | 17 | 12 |
| 346 | 38.35 | precipitation | 0.1 | 10 | > th | dose dependent | no | NA | NA |
| 409 | 38.36 | precipitation | 0.1 | 10 | < th | dose independent | sin | 3 | NA |
| 410 | 38.36 | precipitation | 0.1 | 10 | < th | dose independent | sin | 5 | NA |
| 433 | 38.36 | precipitation | 0.1 | 10 | < th | dose dependent | sin | 3 | NA |
| 434 | 38.36 | precipitation | 0.1 | 10 | < th | dose dependent | sin | 5 | NA |
| 741 | 38.67 | precipitation | 0.1 | 10 | > th | dose independent | rect. | 17 | 12 |
| 793 | 38.71 | precipitation | 0.1 | 10 | < th | dose independent | rect. | 3 | 23 |
| 796 | 38.71 | precipitation | 0.1 | 10 | < th | dose dependent | rect. | 3 | 23 |
| 830 | 38.82 | wind | 5.0 | 90 | > th | dose independent | rect. | 3 | 4 |
| 835 | 38.83 | precipitation | 0.1 | 10 | > th | dose independent | no | NA | NA |
| 836 | 38.83 | precipitation | 0.1 | 10 | < th | dose independent | no | NA | NA |
| 897 | 38.83 | precipitation | 0.1 | 10 | < th | dose dependent | no | NA | NA |