Os10g0393500
blastp(Os)/ blastp(At)/ coex/// RAP/ RiceXPro/ SALAD/ ATTED-II
Description : Lipolytic enzyme, G-D-S-L family protein.


FiT-DB / Search/ Help/ Sample detail
|
Os10g0393500 |
blastp(Os)/ blastp(At)/ coex/// RAP/ RiceXPro/ SALAD/ ATTED-II |
|
Description : Lipolytic enzyme, G-D-S-L family protein.
|
|
log2(Expression) ~ Norm(μ, σ2)
μ = α + β1D + β2C + β3E + β4D*C + β5D*E + γ1N8
|
_____ |
|
 __
__

Dependence on each variable

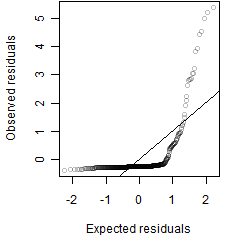
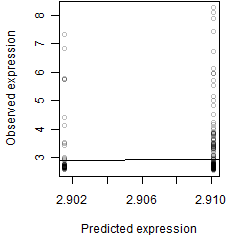
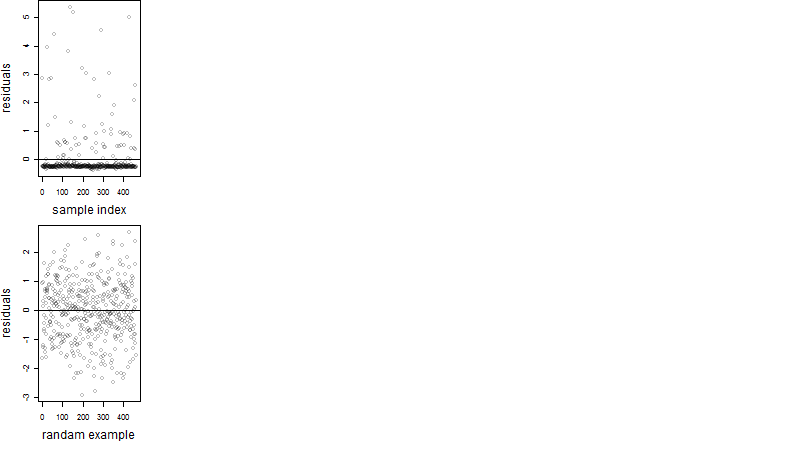
Residual plot
Process of the parameter reduction
(fixed parameters. wheather = radiation,
response mode = > th, dose dependency = dose dependent, type of G = no)
| deviance | σ | α | β1 | β2 | β3 | β4 | β5 | γ1 | peak time of C | threshold | memory length | peak or start time of G | open length of G |
|---|---|---|---|---|---|---|---|---|---|---|---|---|---|
| 262.06 | 0.761 | 2.91 | 0.156 | 0.12 | 1.24 | 0.244 | 2.82 | 0.021 | 1.31 | 44.8 | 10 | -- | -- |
| 267.59 | 0.762 | 2.91 | 0.197 | 0.142 | 1.11 | -0.312 | -- | 0.0411 | 0.313 | 44.73 | 15 | -- | -- |
| 262.16 | 0.754 | 2.91 | 0.165 | 0.117 | 1.29 | -- | 2.89 | 0.0257 | 0.414 | 45.01 | 9 | -- | -- |
| 267.88 | 0.762 | 2.9 | 0.198 | 0.13 | 1.09 | -- | -- | 0.0296 | 0.289 | 43.98 | 15 | -- | -- |
| 262.95 | 0.755 | 2.91 | 0.163 | -- | 1.22 | -- | 2.92 | 0.0206 | -- | 45.55 | 9 | -- | -- |
| 279.51 | 0.784 | 2.91 | 0.155 | 0.0258 | -- | 0.498 | -- | 0.0102 | 8.29 | -- | -- | -- | -- |
| 280.2 | 0.784 | 2.91 | 0.171 | 0.0426 | -- | -- | -- | 0.0109 | 12.3 | -- | -- | -- | -- |
| 268.77 | 0.764 | 2.9 | 0.202 | -- | 1 | -- | -- | 0.0327 | -- | 44.76 | 15 | -- | -- |
| 268.92 | 0.764 | 2.91 | -- | 0.129 | 1.06 | -- | -- | 0.0162 | 0.3 | 43.52 | 15 | -- | -- |
| 280.31 | 0.782 | 2.91 | 0.17 | -- | -- | -- | -- | 0.0102 | -- | -- | -- | -- | -- |
| 280.97 | 0.784 | 2.91 | -- | 0.0402 | -- | -- | -- | -0.00817 | 12 | -- | -- | -- | -- |
| 269.84 | 0.765 | 2.91 | -- | -- | 0.976 | -- | -- | 0.00982 | -- | 44.41 | 15 | -- | -- |
| 281.07 | 0.783 | 2.91 | -- | -- | -- | -- | -- | -0.0086 | -- | -- | -- | -- | -- |
Results of the grid search
Summarized heatmap of deviance
|
Histogram 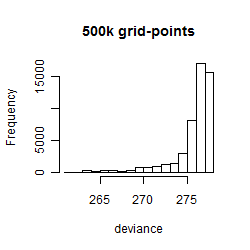
|
Local optima within top1000 grid-points
| rank | deviance | wheather | threshold | memory length | response mode | dose dependency | type of G | peak or start time of G | open length of G |
|---|---|---|---|---|---|---|---|---|---|
| 1 | 261.50 | radiation | 40 | 10 | > th | dose dependent | rect. | 9 | 4 |
| 23 | 262.82 | radiation | 40 | 10 | > th | dose dependent | sin | 1 | NA |
| 46 | 262.90 | radiation | 40 | 10 | > th | dose dependent | rect. | 11 | 23 |
| 51 | 263.07 | radiation | 40 | 10 | > th | dose dependent | no | NA | NA |
| 226 | 263.25 | radiation | 40 | 10 | > th | dose independent | rect. | 11 | 2 |
| 292 | 264.20 | atmosphere | 1000 | 10 | < th | dose independent | rect. | 23 | 1 |