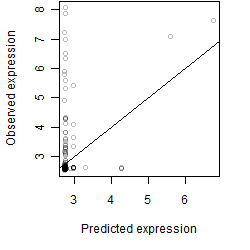
Os09g0473600
blastp(Os)/ blastp(At)/ coex/// RAP/ RiceXPro/ SALAD/ ATTED-II
Description : Conserved hypothetical protein.


FiT-DB / Search/ Help/ Sample detail
|
Os09g0473600 |
blastp(Os)/ blastp(At)/ coex/// RAP/ RiceXPro/ SALAD/ ATTED-II |
|
Description : Conserved hypothetical protein.
|
|
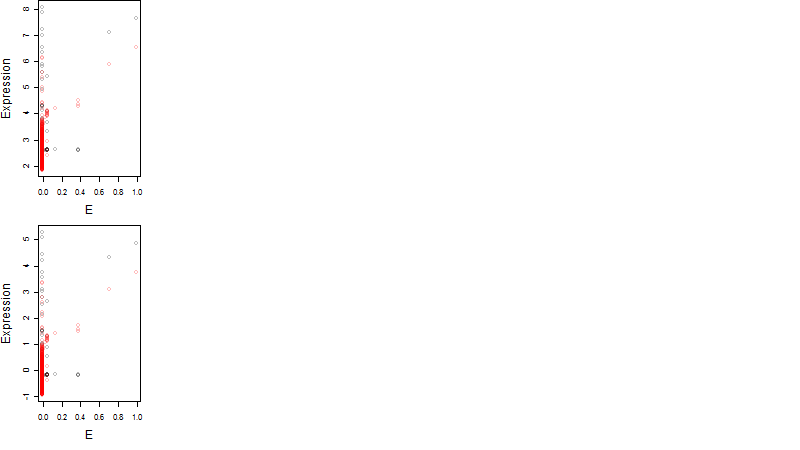
log2(Expression) ~ Norm(μ, σ2)
μ = α + β1D + β2C + β3E + β4D*C + β5D*E + γ1N8
|
_____ |
|

 __
__

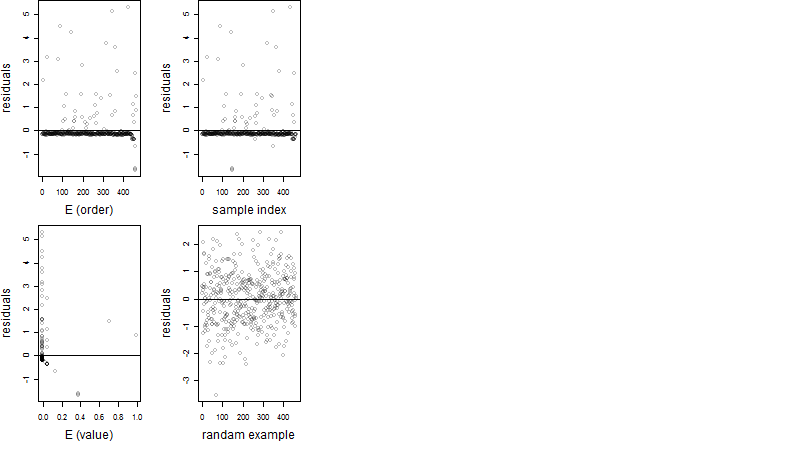
Dependence on each variable
Residual plot
Process of the parameter reduction
(fixed parameters. wheather = humidity,
response mode = < th, dose dependency = dose independent, type of G = no)
| deviance | σ | α | β1 | β2 | β3 | β4 | β5 | γ1 | peak time of C | threshold | memory length | peak or start time of G | open length of G |
|---|---|---|---|---|---|---|---|---|---|---|---|---|---|
| 205.11 | 0.673 | 2.74 | 0.26 | 0.104 | -0.279 | 0.114 | 10.5 | 0.00262 | 3.85 | 48.98 | 158 | -- | -- |
| 211.56 | 0.677 | 2.8 | 0.12 | 0.0381 | 2.95 | 1.14 | -- | -0.00688 | 16.3 | 46.04 | 132 | -- | -- |
| 205.14 | 0.667 | 2.74 | 0.259 | 0.105 | -0.284 | -- | 10.5 | 0.00224 | 4.22 | 48.92 | 158 | -- | -- |
| 207.05 | 0.67 | 2.78 | 0.0624 | 0.0336 | 3.35 | -- | -- | 0.0179 | 4.36 | 48 | 131 | -- | -- |
| 205.68 | 0.668 | 2.74 | 0.274 | -- | -0.451 | -- | 10.7 | 0.0015 | -- | 48.73 | 158 | -- | -- |
| 235 | 0.719 | 2.79 | 0.256 | 0.0142 | -- | 0.67 | -- | -0.0238 | 16.7 | -- | -- | -- | -- |
| 236.16 | 0.72 | 2.78 | 0.259 | 0.0249 | -- | -- | -- | -0.0203 | 13.7 | -- | -- | -- | -- |
| 206.12 | 0.669 | 2.78 | 0.0744 | -- | 3.79 | -- | -- | -0.0047 | -- | 48 | 147 | -- | -- |
| 205.76 | 0.668 | 2.78 | -- | 0.102 | 4.03 | -- | -- | 0.00949 | 4.54 | 47 | 147 | -- | -- |
| 236.2 | 0.718 | 2.78 | 0.258 | -- | -- | -- | -- | -0.0209 | -- | -- | -- | -- | -- |
| 237.93 | 0.722 | 2.79 | -- | 0.0202 | -- | -- | -- | -0.0492 | 13.3 | -- | -- | -- | -- |
| 206.21 | 0.669 | 2.78 | -- | -- | 4.03 | -- | -- | -0.00693 | -- | 47.8 | 147 | -- | -- |
| 237.96 | 0.72 | 2.79 | -- | -- | -- | -- | -- | -0.0496 | -- | -- | -- | -- | -- |
Results of the grid search
Summarized heatmap of deviance
|
Histogram 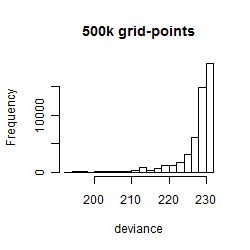
|
Local optima within top1000 grid-points
| rank | deviance | wheather | threshold | memory length | response mode | dose dependency | type of G | peak or start time of G | open length of G |
|---|---|---|---|---|---|---|---|---|---|
| 1 | 193.57 | humidity | 50 | 90 | < th | dose independent | rect. | 13 | 3 |
| 2 | 193.79 | humidity | 50 | 90 | < th | dose dependent | rect. | 12 | 4 |
| 4 | 194.10 | humidity | 50 | 10 | < th | dose dependent | rect. | 14 | 4 |
| 96 | 195.01 | humidity | 60 | 270 | < th | dose dependent | rect. | 12 | 1 |
| 98 | 195.07 | humidity | 50 | 270 | < th | dose independent | rect. | 12 | 1 |
| 192 | 195.75 | humidity | 50 | 10 | < th | dose independent | sin | 12 | NA |
| 235 | 196.29 | humidity | 50 | 10 | > th | dose independent | sin | 12 | NA |
| 288 | 198.36 | humidity | 50 | 30 | < th | dose dependent | sin | 13 | NA |
| 309 | 198.94 | humidity | 50 | 90 | > th | dose independent | sin | 14 | NA |
| 355 | 202.21 | radiation | 40 | 270 | > th | dose independent | rect. | 12 | 1 |
| 470 | 205.46 | humidity | 50 | 270 | < th | dose dependent | sin | 7 | NA |
| 651 | 209.42 | radiation | 30 | 270 | > th | dose dependent | rect. | 12 | 1 |
| 843 | 210.75 | humidity | 50 | 270 | < th | dose independent | rect. | 16 | 23 |
| 951 | 211.48 | humidity | 50 | 270 | < th | dose dependent | rect. | 16 | 23 |