Os08g0541500
blastp(Os)/ blastp(At)/ coex/// RAP/ RiceXPro/ SALAD/ ATTED-II
Description : Protein of unknown function DUF936, plant family protein.


FiT-DB / Search/ Help/ Sample detail
|
Os08g0541500 |
blastp(Os)/ blastp(At)/ coex/// RAP/ RiceXPro/ SALAD/ ATTED-II |
|
Description : Protein of unknown function DUF936, plant family protein.
|
|
log2(Expression) ~ Norm(μ, σ2)
μ = α + β1D + β2C + β3E + β4D*C + β5D*E + γ1N8
|
_____ |
|

 __
__
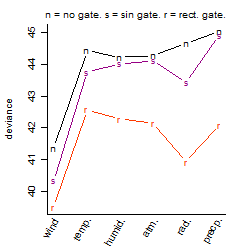
Dependence on each variable

Residual plot

Process of the parameter reduction
(fixed parameters. wheather = wind,
response mode = < th, dose dependency = dose dependent, type of G = no)
| deviance | σ | α | β1 | β2 | β3 | β4 | β5 | γ1 | peak time of C | threshold | memory length | peak or start time of G | open length of G |
|---|---|---|---|---|---|---|---|---|---|---|---|---|---|
| 40.49 | 0.299 | 2.98 | 0.0342 | 0.0655 | -0.378 | -0.343 | 3.86 | 0.0849 | 4.59 | 0.1404 | 9 | -- | -- |
| 44.11 | 0.309 | 2.99 | 0.0118 | 0.0448 | 0.476 | -0.259 | -- | 0.0955 | 5.54 | 0.09994 | 8 | -- | -- |
| 40.76 | 0.297 | 2.98 | 0.0378 | 0.0695 | -0.377 | -- | 3.77 | 0.0876 | 5.98 | 0.12 | 8 | -- | -- |
| 44.28 | 0.31 | 2.99 | 0.0113 | 0.0443 | 0.465 | -- | -- | 0.0965 | 5.83 | 0.07358 | 8 | -- | -- |
| 41 | 0.298 | 2.98 | 0.0383 | -- | -0.331 | -- | 3.69 | 0.0895 | -- | 0.1104 | 8 | -- | -- |
| 45.35 | 0.316 | 2.99 | 0.0363 | 0.0691 | -- | -0.207 | -- | 0.0862 | 5.5 | -- | -- | -- | -- |
| 45.44 | 0.316 | 2.99 | 0.0352 | 0.0689 | -- | -- | -- | 0.0869 | 4.72 | -- | -- | -- | -- |
| 44.38 | 0.31 | 2.99 | 0.0116 | -- | 0.484 | -- | -- | 0.0979 | -- | 0.07541 | 8 | -- | -- |
| 44.28 | 0.31 | 2.99 | -- | 0.0443 | 0.468 | -- | -- | 0.0954 | 5.83 | 0.07454 | 8 | -- | -- |
| 45.7 | 0.316 | 3 | 0.0378 | -- | -- | -- | -- | 0.0887 | -- | -- | -- | -- | -- |
| 45.48 | 0.315 | 3 | -- | 0.0695 | -- | -- | -- | 0.083 | 4.7 | -- | -- | -- | -- |
| 44.38 | 0.31 | 2.99 | -- | -- | 0.487 | -- | -- | 0.0966 | -- | 0.06447 | 8 | -- | -- |
| 45.73 | 0.316 | 3 | -- | -- | -- | -- | -- | 0.0845 | -- | -- | -- | -- | -- |
Results of the grid search
Summarized heatmap of deviance
|
Histogram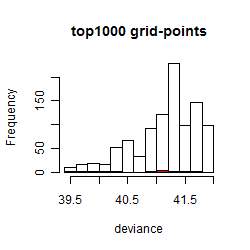 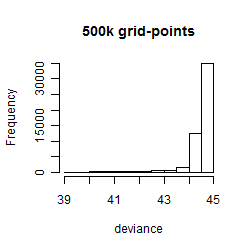
|
Local optima within top1000 grid-points
| rank | deviance | wheather | threshold | memory length | response mode | dose dependency | type of G | peak or start time of G | open length of G |
|---|---|---|---|---|---|---|---|---|---|
| 1 | 39.49 | wind | 1 | 10 | < th | dose independent | rect. | 23 | 1 |
| 5 | 39.49 | wind | 1 | 10 | < th | dose dependent | rect. | 23 | 1 |
| 13 | 39.72 | wind | 1 | 10 | < th | dose dependent | rect. | 11 | 14 |
| 37 | 39.86 | wind | 1 | 30 | < th | dose dependent | rect. | 23 | 5 |
| 47 | 40.10 | wind | 1 | 10 | < th | dose independent | rect. | 11 | 14 |
| 80 | 40.33 | wind | 1 | 10 | < th | dose dependent | sin | 16 | NA |
| 226 | 40.91 | radiation | 10 | 10 | > th | dose independent | rect. | 6 | 1 |
| 252 | 40.91 | radiation | 10 | 10 | > th | dose dependent | rect. | 6 | 1 |
| 349 | 41.06 | wind | 1 | 10 | < th | dose dependent | rect. | 2 | 23 |
| 361 | 41.09 | wind | 1 | 90 | < th | dose independent | rect. | 17 | 8 |
| 391 | 41.14 | wind | 1 | 10 | < th | dose dependent | rect. | 22 | 14 |
| 606 | 41.36 | wind | 1 | 10 | < th | dose dependent | no | NA | NA |
| 668 | 41.48 | wind | 1 | 90 | < th | dose independent | rect. | 11 | 14 |
| 672 | 41.50 | wind | 1 | 10 | < th | dose independent | sin | 15 | NA |
| 867 | 41.74 | wind | 1 | 30 | > th | dose independent | sin | 15 | NA |