Os08g0485500
blastp(Os)/ blastp(At)/ coex/// RAP/ RiceXPro/ SALAD/ ATTED-II
Description : Conserved hypothetical protein.

FiT-DB / Search/ Help/ Sample detail
|
Os08g0485500 |
blastp(Os)/ blastp(At)/ coex/// RAP/ RiceXPro/ SALAD/ ATTED-II |
|
Description : Conserved hypothetical protein.
|
|
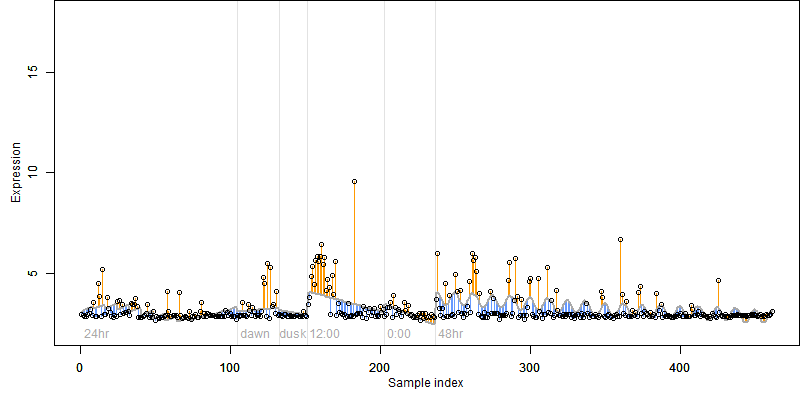
log2(Expression) ~ Norm(μ, σ2)
μ = α + β1D + β2C + β3E + β4D*C + β5D*E + γ1N8
|
_____ |
|
 __
__
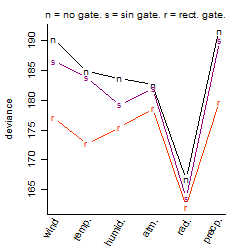
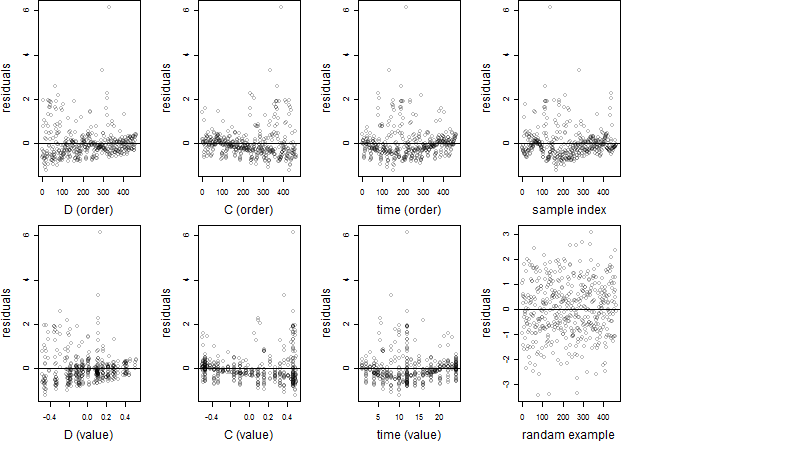
Dependence on each variable

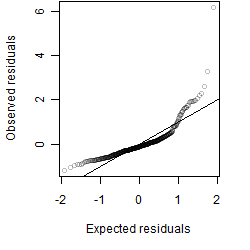
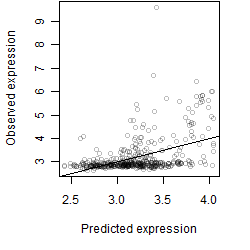
Residual plot
Process of the parameter reduction
(fixed parameters. wheather = radiation,
response mode = > th, dose dependency = dose dependent, type of G = no)
| deviance | σ | α | β1 | β2 | β3 | β4 | β5 | γ1 | peak time of C | threshold | memory length | peak or start time of G | open length of G |
|---|---|---|---|---|---|---|---|---|---|---|---|---|---|
| 166.49 | 0.606 | 3.26 | -0.91 | 0.225 | 1.07 | 0.397 | -2.95 | -0.313 | 6.35 | -0.5722 | 10 | -- | -- |
| 176.56 | 0.619 | 3.28 | -0.997 | 0.151 | 1.24 | 1.8 | -- | -0.354 | 1.42 | -0.3571 | 9 | -- | -- |
| 166.87 | 0.602 | 3.26 | -0.91 | 0.227 | 1.06 | -- | -2.9 | -0.315 | 6.52 | -5.727e-05 | 9 | -- | -- |
| 187.23 | 0.637 | 3.26 | -1.01 | 0.23 | 1.12 | -- | -- | -0.328 | 5.9 | -10.57 | 9 | -- | -- |
| 169.53 | 0.606 | 3.26 | -0.901 | -- | 1.08 | -- | -2.9 | -0.31 | -- | -0.6151 | 9 | -- | -- |
| 192.91 | 0.651 | 3.25 | -0.929 | 0.635 | -- | -1.62 | -- | -0.32 | 11.3 | -- | -- | -- | -- |
| 203.83 | 0.669 | 3.25 | -0.998 | 0.651 | -- | -- | -- | -0.328 | 10.8 | -- | -- | -- | -- |
| 189.96 | 0.642 | 3.27 | -1 | -- | 1.11 | -- | -- | -0.323 | -- | -8.305 | 9 | -- | -- |
| 214 | 0.681 | 3.24 | -- | 0.215 | 1.1 | -- | -- | -0.215 | 6.31 | -0.05088 | 9 | -- | -- |
| 230.06 | 0.709 | 3.27 | -1.01 | -- | -- | -- | -- | -0.332 | -- | -- | -- | -- | -- |
| 230.09 | 0.71 | 3.23 | -- | 0.659 | -- | -- | -- | -0.217 | 10.9 | -- | -- | -- | -- |
| 216.39 | 0.685 | 3.24 | -- | -- | 1.11 | -- | -- | -0.211 | -- | -5.389 | 9 | -- | -- |
| 257.05 | 0.748 | 3.24 | -- | -- | -- | -- | -- | -0.22 | -- | -- | -- | -- | -- |
Results of the grid search
Summarized heatmap of deviance
|
Histogram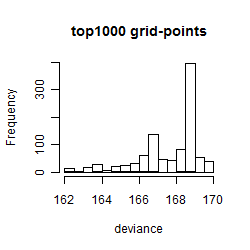 
|
Local optima within top1000 grid-points
| rank | deviance | wheather | threshold | memory length | response mode | dose dependency | type of G | peak or start time of G | open length of G |
|---|---|---|---|---|---|---|---|---|---|
| 1 | 162.10 | radiation | 1 | 10 | > th | dose dependent | rect. | 18 | 18 |
| 2 | 162.12 | radiation | 1 | 10 | > th | dose dependent | rect. | 5 | 7 |
| 15 | 162.87 | radiation | 10 | 10 | > th | dose dependent | rect. | 8 | 4 |
| 34 | 163.56 | radiation | 1 | 10 | > th | dose dependent | sin | 3 | NA |
| 36 | 163.59 | radiation | 40 | 10 | > th | dose dependent | rect. | 9 | 3 |
| 58 | 163.86 | radiation | 1 | 10 | > th | dose dependent | rect. | 13 | 23 |
| 69 | 164.84 | radiation | 10 | 10 | > th | dose dependent | rect. | 11 | 1 |
| 105 | 165.23 | radiation | 1 | 10 | > th | dose dependent | rect. | 16 | 23 |
| 110 | 165.54 | radiation | 1 | 10 | > th | dose dependent | rect. | 5 | 10 |
| 136 | 165.80 | radiation | 1 | 10 | > th | dose dependent | rect. | 8 | 7 |
| 140 | 165.97 | radiation | 1 | 10 | > th | dose dependent | rect. | 11 | 23 |
| 157 | 166.10 | radiation | 40 | 10 | > th | dose independent | rect. | 9 | 3 |
| 177 | 166.14 | radiation | 1 | 10 | > th | dose dependent | rect. | 8 | 22 |
| 205 | 166.59 | radiation | 40 | 10 | > th | dose dependent | sin | 7 | NA |
| 213 | 166.73 | radiation | 1 | 10 | > th | dose dependent | no | NA | NA |
| 216 | 166.73 | radiation | 1 | 10 | > th | dose dependent | rect. | 5 | 14 |
| 299 | 166.86 | radiation | 1 | 10 | > th | dose dependent | rect. | 8 | 11 |
| 485 | 168.30 | radiation | 40 | 10 | > th | dose independent | rect. | 11 | 1 |
| 491 | 168.41 | radiation | 40 | 10 | < th | dose dependent | sin | 3 | NA |
| 648 | 168.75 | radiation | 40 | 10 | > th | dose dependent | no | NA | NA |
| 850 | 168.84 | radiation | 40 | 10 | > th | dose dependent | rect. | 11 | 23 |