Os08g0271600
blastp(Os)/ blastp(At)/ coex/// RAP/ RiceXPro/ SALAD/ ATTED-II
Description : Conserved hypothetical protein.


FiT-DB / Search/ Help/ Sample detail
|
Os08g0271600 |
blastp(Os)/ blastp(At)/ coex/// RAP/ RiceXPro/ SALAD/ ATTED-II |
|
Description : Conserved hypothetical protein.
|
|
log2(Expression) ~ Norm(μ, σ2)
μ = α + β1D + β2C + β3E + β4D*C + β5D*E + γ1N8
|
_____ |
|

 __
__
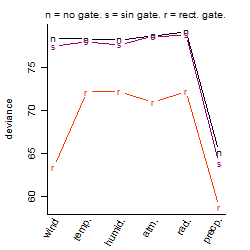
Dependence on each variable

Residual plot

Process of the parameter reduction
(fixed parameters. wheather = precipitation,
response mode = > th, dose dependency = dose dependent, type of G = no)
| deviance | σ | α | β1 | β2 | β3 | β4 | β5 | γ1 | peak time of C | threshold | memory length | peak or start time of G | open length of G |
|---|---|---|---|---|---|---|---|---|---|---|---|---|---|
| 63.48 | 0.374 | 3.3 | 0.189 | 0.244 | -3.4 | -0.241 | 26.2 | 0.00416 | 7.16 | 0.4808 | 10 | -- | -- |
| 63.59 | 0.374 | 3.32 | 0.138 | 0.238 | 4.12 | -0.263 | -- | 0.00479 | 7.17 | 0.4808 | 10 | -- | -- |
| 63.62 | 0.372 | 3.3 | 0.184 | 0.243 | -2.93 | -- | 24.5 | 0.00512 | 7.31 | 0.4772 | 9 | -- | -- |
| 63.69 | 0.372 | 3.32 | 0.129 | 0.236 | 4.1 | -- | -- | 0.0082 | 7.38 | 0.4703 | 9 | -- | -- |
| 66.72 | 0.38 | 3.31 | 0.188 | -- | -3.03 | -- | 25.1 | 0.00923 | -- | 0.4914 | 9 | -- | -- |
| 80.35 | 0.42 | 3.32 | 0.175 | 0.263 | -- | -0.127 | -- | -0.00271 | 6.95 | -- | -- | -- | -- |
| 80.39 | 0.42 | 3.32 | 0.173 | 0.263 | -- | -- | -- | -0.00239 | 6.95 | -- | -- | -- | -- |
| 66.75 | 0.382 | 3.33 | 0.137 | -- | 4.17 | -- | -- | 0.00959 | -- | 0.6385 | 9 | -- | -- |
| 64.11 | 0.373 | 3.32 | -- | 0.242 | 4.13 | -- | -- | -0.00637 | 7.36 | 0.4605 | 9 | -- | -- |
| 84.02 | 0.428 | 3.33 | 0.178 | -- | -- | -- | -- | 0.00252 | -- | -- | -- | -- | -- |
| 81.18 | 0.421 | 3.33 | -- | 0.265 | -- | -- | -- | -0.0217 | 6.91 | -- | -- | -- | -- |
| 67.19 | 0.382 | 3.33 | -- | -- | 4.21 | -- | -- | -0.00389 | -- | 0.4763 | 8 | -- | -- |
| 84.86 | 0.43 | 3.33 | -- | -- | -- | -- | -- | -0.0173 | -- | -- | -- | -- | -- |
Results of the grid search
Summarized heatmap of deviance
|
Histogram 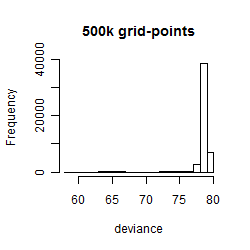
|
Local optima within top1000 grid-points
| rank | deviance | wheather | threshold | memory length | response mode | dose dependency | type of G | peak or start time of G | open length of G |
|---|---|---|---|---|---|---|---|---|---|
| 1 | 58.79 | precipitation | 0.1 | 10 | < th | dose independent | rect. | 3 | 23 |
| 2 | 58.79 | precipitation | 0.1 | 10 | < th | dose dependent | rect. | 3 | 23 |
| 3 | 63.44 | wind | 3.0 | 10 | > th | dose independent | rect. | 4 | 1 |
| 5 | 63.44 | wind | 3.0 | 10 | > th | dose dependent | rect. | 4 | 1 |
| 7 | 63.58 | precipitation | 0.1 | 90 | > th | dose independent | rect. | 4 | 1 |
| 8 | 63.58 | precipitation | 0.1 | 10 | > th | dose independent | rect. | 4 | 2 |
| 12 | 63.58 | precipitation | 0.1 | 90 | > th | dose dependent | rect. | 4 | 1 |
| 13 | 63.58 | precipitation | 0.1 | 10 | > th | dose dependent | rect. | 4 | 2 |
| 76 | 63.75 | precipitation | 0.1 | 10 | > th | dose dependent | rect. | 3 | 15 |
| 122 | 63.82 | precipitation | 0.1 | 10 | > th | dose dependent | rect. | 23 | 19 |
| 152 | 63.89 | precipitation | 0.1 | 10 | > th | dose dependent | sin | 5 | NA |
| 262 | 64.05 | precipitation | 0.1 | 10 | < th | dose independent | sin | 5 | NA |
| 267 | 64.05 | precipitation | 0.1 | 10 | < th | dose dependent | sin | 5 | NA |
| 299 | 64.15 | precipitation | 0.1 | 10 | > th | dose independent | sin | 5 | NA |
| 626 | 65.09 | wind | 5.0 | 90 | > th | dose dependent | rect. | 3 | 4 |
| 628 | 65.13 | precipitation | 0.1 | 10 | > th | dose dependent | no | NA | NA |
| 708 | 65.21 | wind | 5.0 | 90 | > th | dose independent | rect. | 3 | 4 |
| 953 | 66.73 | precipitation | 0.1 | 10 | > th | dose independent | no | NA | NA |
| 954 | 66.73 | precipitation | 0.1 | 10 | < th | dose independent | no | NA | NA |