Os07g0531400
blastp(Os)/ blastp(At)/ coex/// RAP/ RiceXPro/ SALAD/ ATTED-II
Description : Similar to Peroxidase 27 precursor (EC 1.11.1.7) (Atperox P27) (PRXR7) (ATP12a).


FiT-DB / Search/ Help/ Sample detail
|
Os07g0531400 |
blastp(Os)/ blastp(At)/ coex/// RAP/ RiceXPro/ SALAD/ ATTED-II |
|
Description : Similar to Peroxidase 27 precursor (EC 1.11.1.7) (Atperox P27) (PRXR7) (ATP12a).
|
|
log2(Expression) ~ Norm(μ, σ2)
μ = α + β1D + β2C + β3E + β4D*C + β5D*E + γ1N8
|
_____ |
|

 __
__

Dependence on each variable

Residual plot

Process of the parameter reduction
(fixed parameters. wheather = wind,
response mode = < th, dose dependency = dose independent, type of G = no)
| deviance | σ | α | β1 | β2 | β3 | β4 | β5 | γ1 | peak time of C | threshold | memory length | peak or start time of G | open length of G |
|---|---|---|---|---|---|---|---|---|---|---|---|---|---|
| 44.37 | 0.313 | 2.85 | 0.0579 | 0.14 | -4.36 | -0.657 | -9.66 | 0.0141 | 5.13 | 8.983 | 29 | -- | -- |
| 47.58 | 0.321 | 2.81 | 0.0066 | 0.151 | -2.51 | -0.498 | -- | 0.00733 | 5.6 | 8.9 | 18 | -- | -- |
| 45.37 | 0.314 | 2.85 | 0.0527 | 0.14 | -4.31 | -- | -9.87 | 0.0158 | 6.11 | 8.976 | 25 | -- | -- |
| 48.16 | 0.323 | 2.82 | 0.00256 | 0.135 | -1.97 | -- | -- | 0.0228 | 5.85 | 8.924 | 18 | -- | -- |
| 46.35 | 0.317 | 2.85 | 0.0552 | -- | -4.33 | -- | -10.2 | 0.0179 | -- | 8.978 | 25 | -- | -- |
| 55.79 | 0.35 | 2.83 | -0.104 | 0.0834 | -- | -0.508 | -- | -0.0186 | 5.01 | -- | -- | -- | -- |
| 56.22 | 0.351 | 2.83 | -0.102 | 0.103 | -- | -- | -- | -0.0158 | 7.4 | -- | -- | -- | -- |
| 49.09 | 0.326 | 2.82 | 0.00299 | -- | -1.9 | -- | -- | 0.0246 | -- | 8.916 | 18 | -- | -- |
| 48.16 | 0.323 | 2.82 | -- | 0.135 | -1.97 | -- | -- | 0.0225 | 5.84 | 8.925 | 18 | -- | -- |
| 56.79 | 0.352 | 2.83 | -0.1 | -- | -- | -- | -- | -0.0141 | -- | -- | -- | -- | -- |
| 56.49 | 0.352 | 2.82 | -- | 0.102 | -- | -- | -- | -0.00444 | 7.47 | -- | -- | -- | -- |
| 49.09 | 0.326 | 2.82 | -- | -- | -1.9 | -- | -- | 0.0242 | -- | 8.922 | 18 | -- | -- |
| 57.05 | 0.353 | 2.82 | -- | -- | -- | -- | -- | -0.003 | -- | -- | -- | -- | -- |
Results of the grid search
Summarized heatmap of deviance
|
Histogram 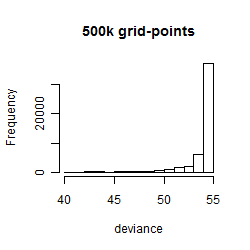
|
Local optima within top1000 grid-points
| rank | deviance | wheather | threshold | memory length | response mode | dose dependency | type of G | peak or start time of G | open length of G |
|---|---|---|---|---|---|---|---|---|---|
| 1 | 40.91 | wind | 9 | 30 | > th | dose dependent | rect. | 11 | 1 |
| 30 | 41.35 | wind | 9 | 30 | > th | dose independent | rect. | 11 | 1 |
| 32 | 41.50 | wind | 9 | 30 | > th | dose dependent | sin | 5 | NA |
| 76 | 42.68 | wind | 9 | 30 | > th | dose independent | sin | 4 | NA |
| 78 | 42.72 | wind | 9 | 30 | < th | dose independent | sin | 5 | NA |
| 114 | 43.15 | wind | 9 | 30 | > th | dose independent | rect. | 11 | 5 |
| 118 | 43.24 | wind | 9 | 30 | > th | dose dependent | rect. | 11 | 5 |
| 290 | 45.25 | wind | 9 | 30 | > th | dose independent | rect. | 15 | 21 |
| 294 | 45.26 | wind | 9 | 30 | < th | dose independent | no | NA | NA |
| 527 | 46.18 | wind | 9 | 30 | > th | dose independent | no | NA | NA |
| 693 | 46.91 | wind | 9 | 30 | > th | dose dependent | rect. | 15 | 21 |
| 917 | 47.50 | radiation | 10 | 10 | < th | dose independent | rect. | 12 | 1 |
| 927 | 47.53 | wind | 9 | 30 | > th | dose dependent | no | NA | NA |