Os07g0272700
blastp(Os)/ blastp(At)/ coex/// RAP/ RiceXPro/ SALAD/ ATTED-II
Description : No apical meristem (NAM) protein domain containing protein.


FiT-DB / Search/ Help/ Sample detail
|
Os07g0272700 |
blastp(Os)/ blastp(At)/ coex/// RAP/ RiceXPro/ SALAD/ ATTED-II |
|
Description : No apical meristem (NAM) protein domain containing protein.
|
|
log2(Expression) ~ Norm(μ, σ2)
μ = α + β1D + β2C + β3E + β4D*C + β5D*E + γ1N8
|
_____ |
|

 __
__
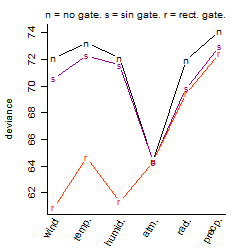
Dependence on each variable

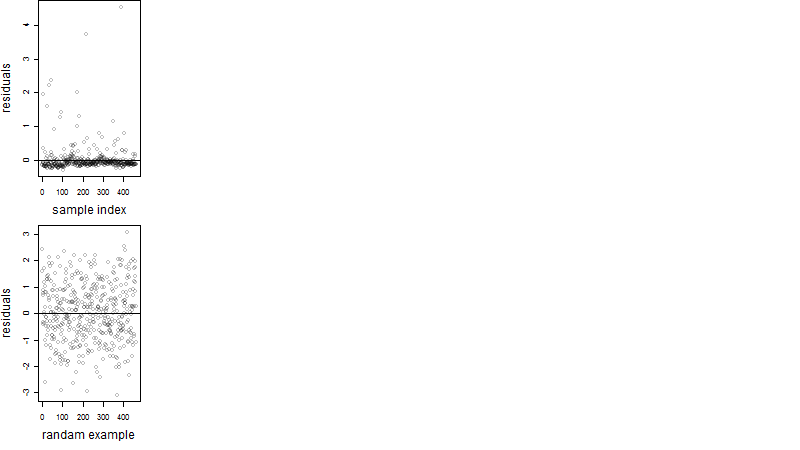
Residual plot
Process of the parameter reduction
(fixed parameters. wheather = atmosphere,
response mode = > th, dose dependency = dose dependent, type of G = no)
| deviance | σ | α | β1 | β2 | β3 | β4 | β5 | γ1 | peak time of C | threshold | memory length | peak or start time of G | open length of G |
|---|---|---|---|---|---|---|---|---|---|---|---|---|---|
| 64.32 | 0.374 | 2.95 | -0.0457 | 0.153 | 1.34 | -0.0723 | -3.05 | 0.0719 | 13.4 | 1015 | 10 | -- | -- |
| 65.19 | 0.376 | 2.96 | -0.000447 | 0.176 | 2.01 | 0.0481 | -- | 0.0513 | 13.8 | 1016 | 2 | -- | -- |
| 64.34 | 0.376 | 2.95 | -0.0472 | 0.153 | 1.3 | -- | -2.89 | 0.0714 | 13.4 | 1015 | 14 | -- | -- |
| 65.01 | 0.376 | 2.95 | -0.0436 | 0.157 | 2.12 | -- | -- | 0.0705 | 13.4 | 1016 | 2 | -- | -- |
| 65.76 | 0.38 | 2.96 | -0.0534 | -- | 1.22 | -- | -2.89 | 0.0673 | -- | 1015 | 14 | -- | -- |
| 74.7 | 0.405 | 2.96 | -0.0891 | 0.116 | -- | 0.122 | -- | 0.0496 | 14 | -- | -- | -- | -- |
| 74.75 | 0.405 | 2.96 | -0.0854 | 0.116 | -- | -- | -- | 0.0503 | 14 | -- | -- | -- | -- |
| 65.77 | 0.379 | 2.96 | -0.0268 | -- | 2.23 | -- | -- | 0.0671 | -- | 1016 | 2 | -- | -- |
| 65.06 | 0.376 | 2.95 | -- | 0.159 | 2.13 | -- | -- | 0.0762 | 13.4 | 1016 | 2 | -- | -- |
| 75.56 | 0.406 | 2.96 | -0.0902 | -- | -- | -- | -- | 0.0476 | -- | -- | -- | -- | -- |
| 74.94 | 0.405 | 2.96 | -- | 0.117 | -- | -- | -- | 0.0598 | 14 | -- | -- | -- | -- |
| 65.79 | 0.379 | 2.96 | -- | -- | 2.24 | -- | -- | 0.0701 | -- | 1016 | 2 | -- | -- |
| 75.78 | 0.406 | 2.96 | -- | -- | -- | -- | -- | 0.0576 | -- | -- | -- | -- | -- |
Results of the grid search
Summarized heatmap of deviance
|
Histogram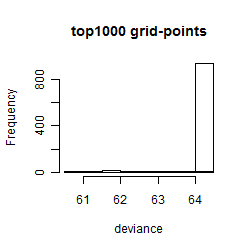 
|
Local optima within top1000 grid-points
| rank | deviance | wheather | threshold | memory length | response mode | dose dependency | type of G | peak or start time of G | open length of G |
|---|---|---|---|---|---|---|---|---|---|
| 1 | 60.91 | wind | 5 | 10 | > th | dose independent | rect. | 10 | 1 |
| 5 | 60.91 | wind | 5 | 10 | > th | dose dependent | rect. | 10 | 1 |
| 9 | 61.03 | wind | 7 | 90 | > th | dose dependent | rect. | 8 | 1 |
| 10 | 61.21 | wind | 7 | 90 | > th | dose independent | rect. | 8 | 1 |
| 11 | 61.33 | humidity | 90 | 90 | > th | dose independent | rect. | 8 | 2 |
| 32 | 61.64 | humidity | 90 | 90 | > th | dose dependent | rect. | 8 | 2 |
| 39 | 62.33 | wind | 9 | 90 | > th | dose dependent | rect. | 22 | 12 |
| 64 | 64.30 | atmosphere | 1015 | 10 | < th | dose independent | sin | 10 | NA |
| 67 | 64.30 | atmosphere | 1015 | 270 | < th | dose independent | sin | 12 | NA |
| 68 | 64.30 | atmosphere | 1015 | 10 | < th | dose independent | sin | 21 | NA |
| 72 | 64.30 | atmosphere | 1015 | 270 | < th | dose independent | sin | 0 | NA |
| 82 | 64.32 | atmosphere | 1015 | 10 | > th | dose independent | sin | 7 | NA |
| 178 | 64.32 | atmosphere | 1015 | 10 | > th | dose independent | no | NA | NA |
| 187 | 64.32 | atmosphere | 1015 | 10 | < th | dose independent | no | NA | NA |
| 191 | 64.32 | atmosphere | 1015 | 270 | > th | dose independent | rect. | 20 | 1 |
| 198 | 64.32 | atmosphere | 1015 | 10 | > th | dose independent | rect. | 23 | 1 |