Os07g0251900
blastp(Os)/ blastp(At)/ coex/// RAP/ RiceXPro/ SALAD/ ATTED-II
Description : Leucine rich repeat, N-terminal domain containing protein.


FiT-DB / Search/ Help/ Sample detail
|
Os07g0251900 |
blastp(Os)/ blastp(At)/ coex/// RAP/ RiceXPro/ SALAD/ ATTED-II |
|
Description : Leucine rich repeat, N-terminal domain containing protein.
|
|
log2(Expression) ~ Norm(μ, σ2)
μ = α + β1D + β2C + β3E + β4D*C + β5D*E + γ1N8
|
_____ |
|

 __
__
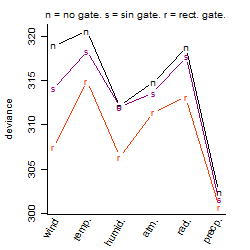
Dependence on each variable

Residual plot

Process of the parameter reduction
(fixed parameters. wheather = precipitation,
response mode = > th, dose dependency = dose dependent, type of G = no)
| deviance | σ | α | β1 | β2 | β3 | β4 | β5 | γ1 | peak time of C | threshold | memory length | peak or start time of G | open length of G |
|---|---|---|---|---|---|---|---|---|---|---|---|---|---|
| 299.89 | 0.814 | 3.65 | -0.801 | 0.244 | 5.1 | 0.222 | -11.1 | -0.22 | 6.24 | -5.613e-05 | 835 | -- | -- |
| 314.11 | 0.825 | 3.55 | -0.388 | 0.27 | 2.76 | 1.16 | -- | -0.168 | 4.84 | 0.2726 | 416 | -- | -- |
| 299.48 | 0.806 | 3.65 | -0.825 | 0.238 | 5.19 | -- | -11.3 | -0.22 | 6.33 | -0.137 | 899 | -- | -- |
| 305.22 | 0.814 | 3.58 | -0.603 | 0.194 | 2.06 | -- | -- | -0.248 | 4.59 | 0.25 | 992 | -- | -- |
| 302.47 | 0.81 | 3.65 | -0.82 | -- | 5.14 | -- | -11 | -0.213 | -- | -0.1514 | 899 | -- | -- |
| 332.91 | 0.855 | 3.58 | -0.336 | 0.247 | -- | 0.529 | -- | -0.309 | 4.79 | -- | -- | -- | -- |
| 333.49 | 0.855 | 3.58 | -0.337 | 0.258 | -- | -- | -- | -0.312 | 5.53 | -- | -- | -- | -- |
| 307.18 | 0.816 | 3.57 | -0.57 | -- | 2.07 | -- | -- | -0.252 | -- | 0.3335 | 908 | -- | -- |
| 313.69 | 0.825 | 3.56 | -- | 0.22 | 1.73 | -- | -- | -0.211 | 4.88 | 0.3727 | 900 | -- | -- |
| 336.96 | 0.858 | 3.58 | -0.328 | -- | -- | -- | -- | -0.305 | -- | -- | -- | -- | -- |
| 336.48 | 0.858 | 3.57 | -- | 0.253 | -- | -- | -- | -0.274 | 5.58 | -- | -- | -- | -- |
| 315.82 | 0.828 | 3.56 | -- | -- | 1.83 | -- | -- | -0.195 | -- | 0.3378 | 900 | -- | -- |
| 339.8 | 0.86 | 3.58 | -- | -- | -- | -- | -- | -0.269 | -- | -- | -- | -- | -- |
Results of the grid search
Summarized heatmap of deviance
|
Histogram 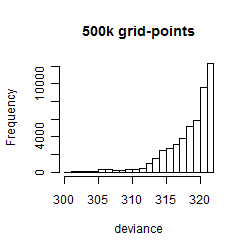
|
Local optima within top1000 grid-points
| rank | deviance | wheather | threshold | memory length | response mode | dose dependency | type of G | peak or start time of G | open length of G |
|---|---|---|---|---|---|---|---|---|---|
| 1 | 300.73 | precipitation | 0.1 | 720 | > th | dose independent | rect. | 2 | 18 |
| 2 | 300.73 | precipitation | 0.1 | 720 | > th | dose independent | rect. | 24 | 20 |
| 6 | 301.01 | precipitation | 0.1 | 720 | > th | dose independent | rect. | 15 | 19 |
| 7 | 301.02 | precipitation | 0.1 | 720 | > th | dose independent | rect. | 15 | 16 |
| 37 | 301.58 | precipitation | 0.1 | 720 | > th | dose independent | sin | 13 | NA |
| 40 | 301.61 | precipitation | 0.1 | 720 | > th | dose dependent | sin | 12 | NA |
| 42 | 301.70 | precipitation | 0.1 | 720 | < th | dose independent | sin | 13 | NA |
| 43 | 301.70 | precipitation | 0.1 | 720 | < th | dose dependent | sin | 13 | NA |
| 53 | 301.86 | precipitation | 0.1 | 720 | > th | dose dependent | rect. | 16 | 22 |
| 56 | 301.90 | precipitation | 0.1 | 720 | > th | dose dependent | rect. | 15 | 20 |
| 80 | 302.19 | precipitation | 0.1 | 720 | > th | dose dependent | rect. | 2 | 18 |
| 81 | 302.19 | precipitation | 0.1 | 720 | > th | dose dependent | rect. | 24 | 20 |
| 104 | 302.31 | precipitation | 0.1 | 720 | > th | dose dependent | rect. | 2 | 23 |
| 122 | 302.39 | precipitation | 0.1 | 720 | > th | dose dependent | no | NA | NA |
| 131 | 302.42 | precipitation | 0.1 | 720 | > th | dose dependent | rect. | 9 | 23 |
| 145 | 302.54 | precipitation | 0.1 | 720 | > th | dose independent | no | NA | NA |
| 146 | 302.54 | precipitation | 0.1 | 720 | < th | dose independent | no | NA | NA |
| 148 | 302.54 | precipitation | 0.1 | 720 | < th | dose dependent | no | NA | NA |
| 156 | 302.58 | precipitation | 0.1 | 720 | > th | dose independent | rect. | 9 | 23 |
| 157 | 302.59 | precipitation | 0.1 | 720 | < th | dose independent | sin | 2 | NA |
| 159 | 302.59 | precipitation | 0.1 | 720 | < th | dose dependent | sin | 2 | NA |
| 165 | 302.76 | precipitation | 0.1 | 720 | > th | dose independent | sin | 2 | NA |
| 168 | 302.77 | precipitation | 0.1 | 720 | > th | dose dependent | rect. | 19 | 23 |
| 190 | 302.94 | precipitation | 0.1 | 720 | > th | dose dependent | sin | 2 | NA |
| 225 | 303.57 | precipitation | 0.1 | 720 | > th | dose independent | rect. | 19 | 23 |
| 240 | 304.16 | precipitation | 0.1 | 720 | < th | dose independent | rect. | 2 | 23 |
| 241 | 304.16 | precipitation | 0.1 | 720 | < th | dose dependent | rect. | 2 | 23 |
| 243 | 304.19 | precipitation | 0.1 | 1440 | < th | dose independent | rect. | 16 | 17 |
| 244 | 304.19 | precipitation | 0.1 | 1440 | < th | dose dependent | rect. | 16 | 17 |
| 254 | 304.39 | precipitation | 0.1 | 1440 | < th | dose independent | rect. | 4 | 15 |
| 256 | 304.39 | precipitation | 0.1 | 1440 | < th | dose dependent | rect. | 4 | 15 |
| 258 | 304.41 | precipitation | 0.1 | 1440 | < th | dose independent | rect. | 16 | 14 |
| 261 | 304.41 | precipitation | 0.1 | 1440 | < th | dose dependent | rect. | 16 | 14 |
| 271 | 304.50 | precipitation | 0.1 | 1440 | < th | dose independent | rect. | 13 | 20 |
| 272 | 304.50 | precipitation | 0.1 | 1440 | < th | dose dependent | rect. | 13 | 20 |
| 279 | 304.62 | precipitation | 0.1 | 1440 | < th | dose independent | rect. | 13 | 17 |
| 281 | 304.62 | precipitation | 0.1 | 1440 | < th | dose dependent | rect. | 13 | 17 |
| 380 | 305.21 | precipitation | 0.1 | 1440 | < th | dose independent | rect. | 24 | 20 |
| 382 | 305.21 | precipitation | 0.1 | 1440 | < th | dose dependent | rect. | 24 | 20 |
| 414 | 305.33 | precipitation | 0.1 | 1440 | < th | dose independent | rect. | 13 | 23 |
| 415 | 305.33 | precipitation | 0.1 | 1440 | < th | dose dependent | rect. | 13 | 23 |
| 557 | 305.80 | precipitation | 0.1 | 1440 | < th | dose independent | rect. | 16 | 23 |
| 559 | 305.80 | precipitation | 0.1 | 1440 | < th | dose dependent | rect. | 16 | 23 |
| 587 | 305.89 | precipitation | 0.1 | 1440 | < th | dose independent | rect. | 11 | 22 |
| 589 | 305.89 | precipitation | 0.1 | 1440 | < th | dose dependent | rect. | 11 | 22 |
| 649 | 306.08 | precipitation | 0.1 | 1440 | > th | dose dependent | rect. | 4 | 13 |
| 744 | 306.39 | humidity | 80.0 | 4320 | < th | dose dependent | rect. | 20 | 1 |
| 759 | 306.46 | humidity | 90.0 | 1440 | > th | dose dependent | rect. | 10 | 4 |
| 763 | 306.48 | precipitation | 0.1 | 1440 | < th | dose independent | rect. | 7 | 23 |
| 764 | 306.48 | precipitation | 0.1 | 1440 | < th | dose dependent | rect. | 7 | 23 |
| 768 | 306.50 | humidity | 90.0 | 1440 | > th | dose independent | rect. | 10 | 4 |
| 805 | 306.59 | humidity | 50.0 | 720 | > th | dose dependent | rect. | 16 | 3 |