Os07g0181100
blastp(Os)/ blastp(At)/ coex/// RAP/ RiceXPro/ SALAD/ ATTED-II
Description : C4-dicarboxylate transporter/malic acid transport protein family protein.


FiT-DB / Search/ Help/ Sample detail
|
Os07g0181100 |
blastp(Os)/ blastp(At)/ coex/// RAP/ RiceXPro/ SALAD/ ATTED-II |
|
Description : C4-dicarboxylate transporter/malic acid transport protein family protein.
|
|
log2(Expression) ~ Norm(μ, σ2)
μ = α + β1D + β2C + β3E + β4D*C + β5D*E + γ1N8
|
_____ |
|

 __
__

Dependence on each variable

Residual plot

Process of the parameter reduction
(fixed parameters. wheather = wind,
response mode = > th, dose dependency = dose dependent, type of G = rect.)
| deviance | σ | α | β1 | β2 | β3 | β4 | β5 | γ1 | peak time of C | threshold | memory length | peak or start time of G | open length of G |
|---|---|---|---|---|---|---|---|---|---|---|---|---|---|
| 92.04 | 0.451 | 2.97 | 0.334 | 0.177 | 15.1 | -0.215 | 55.9 | 0.182 | 3.49 | 4.989 | 257 | 3.04 | 1.12 |
| 94.88 | 0.454 | 2.93 | 0.105 | 0.195 | 3.41 | -0.0989 | -- | 0.166 | 5.75 | 6.242 | 300 | 0.967 | 5.26 |
| 92.14 | 0.447 | 2.97 | 0.351 | 0.178 | 15.3 | -- | 57 | 0.194 | 3.38 | 5.034 | 258 | 3.03 | 1.13 |
| 93.64 | 0.451 | 2.91 | 0.0621 | 0.196 | 3.7 | -- | -- | 0.186 | 3.74 | 6.202 | 262 | 1.45 | 4.85 |
| 93.86 | 0.451 | 2.97 | 0.374 | -- | 15.7 | -- | 58.5 | 0.191 | -- | 5.048 | 257 | 3.05 | 1.07 |
| 116.88 | 0.507 | 2.91 | -0.024 | 0.268 | -- | -0.396 | -- | 0.149 | 4.29 | -- | -- | -- | -- |
| 117.31 | 0.507 | 2.91 | -0.0204 | 0.265 | -- | -- | -- | 0.151 | 4.22 | -- | -- | -- | -- |
| 95.71 | 0.456 | 2.91 | 0.0725 | -- | 3.75 | -- | -- | 0.193 | -- | 6.156 | 265 | 1.34 | 5.08 |
| 93.74 | 0.451 | 2.91 | -- | 0.195 | 3.65 | -- | -- | 0.179 | 3.74 | 6.249 | 271 | 1.47 | 5.22 |
| 121.12 | 0.514 | 2.92 | -0.00972 | -- | -- | -- | -- | 0.158 | -- | -- | -- | -- | -- |
| 117.32 | 0.507 | 2.91 | -- | 0.265 | -- | -- | -- | 0.153 | 4.22 | -- | -- | -- | -- |
| 95.84 | 0.456 | 2.91 | -- | -- | 3.73 | -- | -- | 0.185 | -- | 6.145 | 263 | 1.34 | 5.5 |
| 121.12 | 0.514 | 2.92 | -- | -- | -- | -- | -- | 0.159 | -- | -- | -- | -- | -- |
Results of the grid search
Summarized heatmap of deviance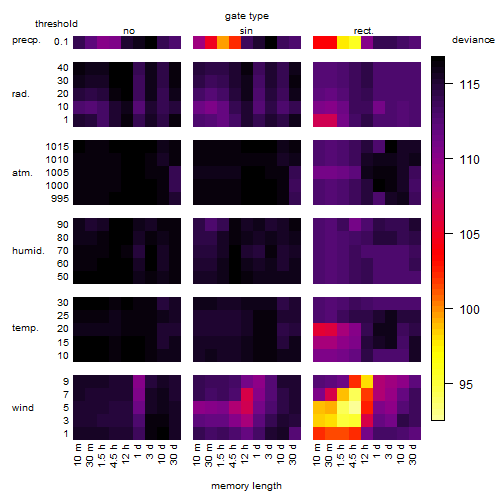
|
Histogram 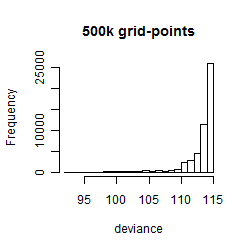
|
Local optima within top1000 grid-points
| rank | deviance | wheather | threshold | memory length | response mode | dose dependency | type of G | peak or start time of G | open length of G |
|---|---|---|---|---|---|---|---|---|---|
| 1 | 92.50 | wind | 5.0 | 270 | > th | dose dependent | rect. | 3 | 1 |
| 2 | 93.37 | wind | 5.0 | 270 | > th | dose independent | rect. | 3 | 1 |
| 4 | 93.86 | wind | 5.0 | 270 | > th | dose dependent | rect. | 1 | 5 |
| 6 | 93.96 | wind | 5.0 | 270 | > th | dose independent | rect. | 1 | 5 |
| 56 | 95.82 | precipitation | 0.1 | 270 | > th | dose dependent | rect. | 3 | 2 |
| 65 | 95.93 | precipitation | 0.1 | 270 | > th | dose independent | rect. | 3 | 2 |
| 107 | 97.35 | precipitation | 0.1 | 270 | > th | dose independent | rect. | 3 | 6 |
| 137 | 97.88 | wind | 9.0 | 720 | > th | dose dependent | rect. | 19 | 2 |
| 138 | 97.89 | wind | 9.0 | 720 | > th | dose independent | rect. | 19 | 3 |
| 140 | 97.92 | wind | 9.0 | 720 | > th | dose independent | rect. | 20 | 1 |
| 265 | 98.83 | wind | 5.0 | 10 | > th | dose independent | rect. | 2 | 6 |
| 332 | 99.53 | precipitation | 0.1 | 90 | > th | dose independent | sin | 6 | NA |
| 344 | 99.71 | precipitation | 0.1 | 90 | < th | dose independent | sin | 6 | NA |
| 348 | 99.71 | precipitation | 0.1 | 90 | < th | dose dependent | sin | 6 | NA |
| 368 | 99.99 | precipitation | 0.1 | 90 | > th | dose dependent | sin | 6 | NA |
| 394 | 100.33 | precipitation | 0.1 | 90 | > th | dose independent | rect. | 5 | 3 |
| 397 | 100.33 | precipitation | 0.1 | 90 | > th | dose dependent | rect. | 5 | 3 |
| 450 | 100.85 | precipitation | 0.1 | 90 | > th | dose independent | rect. | 3 | 13 |
| 687 | 102.31 | precipitation | 0.1 | 90 | > th | dose dependent | rect. | 3 | 13 |
| 913 | 103.57 | precipitation | 0.1 | 10 | > th | dose independent | rect. | 4 | 2 |
| 919 | 103.57 | precipitation | 0.1 | 10 | > th | dose dependent | rect. | 4 | 2 |
| 948 | 103.67 | wind | 5.0 | 720 | < th | dose independent | rect. | 21 | 5 |