Os07g0137800
blastp(Os)/ blastp(At)/ coex/// RAP/ RiceXPro/ SALAD/ ATTED-II
Description : Protein kinase-like domain containing protein.


FiT-DB / Search/ Help/ Sample detail
|
Os07g0137800 |
blastp(Os)/ blastp(At)/ coex/// RAP/ RiceXPro/ SALAD/ ATTED-II |
|
Description : Protein kinase-like domain containing protein.
|
|
log2(Expression) ~ Norm(μ, σ2)
μ = α + β1D + β2C + β3E + β4D*C + β5D*E + γ1N8
|
_____ |
|

 __
__

Dependence on each variable

Residual plot

Process of the parameter reduction
(fixed parameters. wheather = humidity,
response mode = < th, dose dependency = dose dependent, type of G = no)
| deviance | σ | α | β1 | β2 | β3 | β4 | β5 | γ1 | peak time of C | threshold | memory length | peak or start time of G | open length of G |
|---|---|---|---|---|---|---|---|---|---|---|---|---|---|
| 51.94 | 0.339 | 2.99 | -0.0774 | 0.17 | 0.649 | 0.182 | -1.9 | -0.0104 | 5.61 | 58.98 | 10 | -- | -- |
| 54.11 | 0.345 | 2.98 | -0.103 | 0.171 | 0.408 | 0.322 | -- | -0.0203 | 5.1 | 63 | 9 | -- | -- |
| 52.02 | 0.336 | 2.99 | -0.0752 | 0.17 | 0.687 | -- | -2.04 | -0.012 | 5.66 | 58.19 | 10 | -- | -- |
| 54.33 | 0.346 | 2.98 | -0.102 | 0.173 | 0.372 | -- | -- | -0.0234 | 5.73 | 63 | 9 | -- | -- |
| 53.46 | 0.341 | 2.99 | -0.069 | -- | 0.646 | -- | -2.1 | -0.0132 | -- | 57.5 | 10 | -- | -- |
| 55.44 | 0.349 | 2.99 | -0.0936 | 0.146 | -- | 0.12 | -- | -0.0415 | 6.34 | -- | -- | -- | -- |
| 55.47 | 0.349 | 2.99 | -0.0917 | 0.147 | -- | -- | -- | -0.0416 | 6.69 | -- | -- | -- | -- |
| 55.81 | 0.349 | 2.99 | -0.0952 | -- | 0.302 | -- | -- | -0.0242 | -- | 62 | 8 | -- | -- |
| 54.6 | 0.346 | 2.98 | -- | 0.171 | 0.364 | -- | -- | -0.0125 | 5.77 | 63 | 9 | -- | -- |
| 56.59 | 0.352 | 2.99 | -0.0883 | -- | -- | -- | -- | -0.0387 | -- | -- | -- | -- | -- |
| 55.69 | 0.349 | 2.99 | -- | 0.146 | -- | -- | -- | -0.0314 | 6.73 | -- | -- | -- | -- |
| 56.05 | 0.35 | 2.99 | -- | -- | 0.296 | -- | -- | -0.014 | -- | 62 | 8 | -- | -- |
| 56.8 | 0.352 | 2.99 | -- | -- | -- | -- | -- | -0.0289 | -- | -- | -- | -- | -- |
Results of the grid search
Summarized heatmap of deviance
|
Histogram 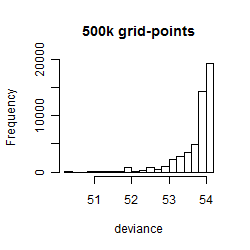
|
Local optima within top1000 grid-points
| rank | deviance | wheather | threshold | memory length | response mode | dose dependency | type of G | peak or start time of G | open length of G |
|---|---|---|---|---|---|---|---|---|---|
| 1 | 50.20 | humidity | 60 | 270 | < th | dose independent | rect. | 8 | 3 |
| 14 | 50.20 | humidity | 60 | 270 | < th | dose dependent | rect. | 8 | 3 |
| 57 | 50.33 | humidity | 60 | 10 | < th | dose dependent | sin | 8 | NA |
| 102 | 50.84 | humidity | 60 | 10 | < th | dose dependent | rect. | 9 | 3 |
| 118 | 50.90 | humidity | 60 | 90 | < th | dose independent | sin | 8 | NA |
| 139 | 50.96 | humidity | 60 | 90 | > th | dose independent | sin | 8 | NA |
| 375 | 51.42 | humidity | 70 | 4320 | > th | dose independent | rect. | 20 | 11 |
| 508 | 51.54 | humidity | 70 | 4320 | < th | dose independent | rect. | 20 | 11 |
| 533 | 51.59 | humidity | 70 | 4320 | < th | dose dependent | rect. | 20 | 11 |
| 601 | 51.68 | radiation | 40 | 10 | > th | dose dependent | sin | 10 | NA |
| 666 | 51.74 | humidity | 60 | 4320 | > th | dose independent | rect. | 20 | 13 |
| 727 | 51.84 | atmosphere | 1010 | 30 | > th | dose dependent | sin | 0 | NA |
| 729 | 51.84 | atmosphere | 1010 | 30 | > th | dose dependent | rect. | 9 | 3 |
| 840 | 51.85 | humidity | 70 | 4320 | < th | dose independent | rect. | 19 | 13 |
| 969 | 51.86 | humidity | 60 | 4320 | > th | dose independent | rect. | 6 | 3 |