Os06g0561800
blastp(Os)/ blastp(At)/ coex/// RAP/ RiceXPro/ SALAD/ ATTED-II
Description : Similar to Multidrug resistance associated protein 1.


FiT-DB / Search/ Help/ Sample detail
|
Os06g0561800 |
blastp(Os)/ blastp(At)/ coex/// RAP/ RiceXPro/ SALAD/ ATTED-II |
|
Description : Similar to Multidrug resistance associated protein 1.
|
|
log2(Expression) ~ Norm(μ, σ2)
μ = α + β1D + β2C + β3E + β4D*C + β5D*E + γ1N8
|
_____ |
|

 __
__
Dependence on each variable

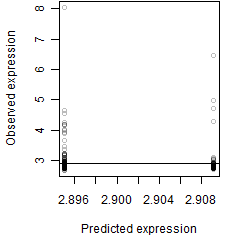
Residual plot

Process of the parameter reduction
(fixed parameters. wheather = atmosphere,
response mode = > th, dose dependency = dose independent, type of G = no)
| deviance | σ | α | β1 | β2 | β3 | β4 | β5 | γ1 | peak time of C | threshold | memory length | peak or start time of G | open length of G |
|---|---|---|---|---|---|---|---|---|---|---|---|---|---|
| 57.88 | 0.354 | 2.89 | -0.104 | 0.11 | 1.33 | 0.15 | -3.38 | 0.0205 | 10.7 | 1015 | 10 | -- | -- |
| 63.71 | 0.375 | 2.89 | -0.156 | 0.0945 | 1.25 | 0.453 | -- | 0.0117 | 12.2 | 1015 | 35 | -- | -- |
| 57.93 | 0.357 | 2.89 | -0.0978 | 0.113 | 1.33 | -- | -3.45 | 0.0205 | 9.9 | 1015 | 10 | -- | -- |
| 61.65 | 0.366 | 2.9 | -0.165 | 0.109 | 1.24 | -- | -- | -0.0214 | 12.2 | 1016 | 84 | -- | -- |
| 58.69 | 0.359 | 2.89 | -0.0992 | -- | 1.28 | -- | -3.45 | 0.0199 | -- | 1015 | 19 | -- | -- |
| 69.75 | 0.392 | 2.9 | -0.157 | 0.0233 | -- | 0.523 | -- | -0.00413 | 14 | -- | -- | -- | -- |
| 70.47 | 0.393 | 2.9 | -0.142 | 0.0799 | -- | -- | -- | -0.00224 | 8.84 | -- | -- | -- | -- |
| 58.75 | 0.357 | 2.89 | -0.0949 | -- | 2.44 | -- | -- | 0.0119 | -- | 1016 | 62 | -- | -- |
| 58.06 | 0.355 | 2.89 | -- | 0.114 | 2.56 | -- | -- | 0.0283 | 9.96 | 1016 | 71 | -- | -- |
| 70.83 | 0.393 | 2.9 | -0.142 | -- | -- | -- | -- | -0.00165 | -- | -- | -- | -- | -- |
| 71 | 0.394 | 2.89 | -- | 0.0796 | -- | -- | -- | 0.0136 | 8.98 | -- | -- | -- | -- |
| 58.84 | 0.357 | 2.89 | -- | -- | 2.51 | -- | -- | 0.0282 | -- | 1016 | 83 | -- | -- |
| 71.36 | 0.394 | 2.9 | -- | -- | -- | -- | -- | 0.0141 | -- | -- | -- | -- | -- |
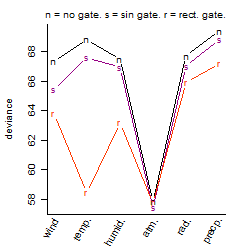
Results of the grid search
Summarized heatmap of deviance
|
Histogram 
|
Local optima within top1000 grid-points
| rank | deviance | wheather | threshold | memory length | response mode | dose dependency | type of G | peak or start time of G | open length of G |
|---|---|---|---|---|---|---|---|---|---|
| 1 | 57.47 | atmosphere | 1015 | 10 | < th | dose independent | sin | 11 | NA |
| 3 | 57.47 | atmosphere | 1015 | 270 | < th | dose independent | sin | 13 | NA |
| 4 | 57.47 | atmosphere | 1015 | 30 | < th | dose independent | sin | 23 | NA |
| 5 | 57.47 | atmosphere | 1015 | 270 | < th | dose independent | sin | 1 | NA |
| 52 | 57.78 | atmosphere | 1015 | 720 | > th | dose dependent | rect. | 3 | 21 |
| 53 | 57.79 | atmosphere | 1015 | 720 | > th | dose independent | sin | 22 | NA |
| 60 | 57.86 | atmosphere | 1015 | 720 | > th | dose dependent | sin | 22 | NA |
| 62 | 57.87 | atmosphere | 1015 | 720 | > th | dose independent | rect. | 22 | 1 |
| 65 | 57.88 | atmosphere | 1015 | 10 | > th | dose independent | sin | 7 | NA |
| 161 | 57.88 | atmosphere | 1015 | 10 | > th | dose independent | no | NA | NA |
| 167 | 57.88 | atmosphere | 1015 | 10 | < th | dose independent | no | NA | NA |
| 177 | 57.88 | atmosphere | 1015 | 10 | > th | dose independent | rect. | 23 | 1 |