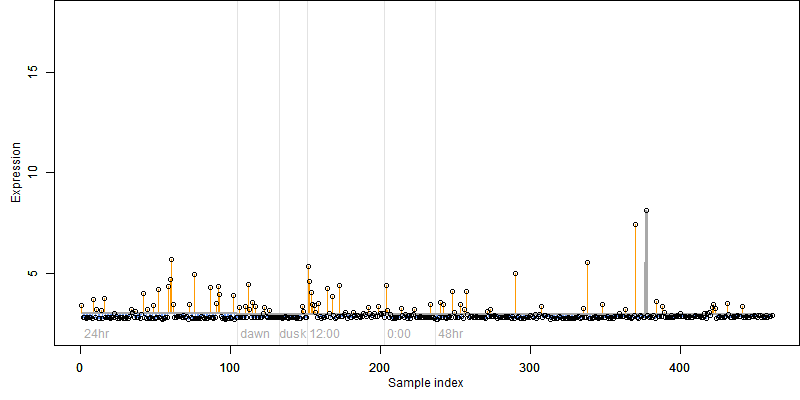
Os06g0490400
blastp(Os)/ blastp(At)/ coex/// RAP/ RiceXPro/ SALAD/ ATTED-II
Description : Similar to Peroxidase (EC 1.11.1.7).

FiT-DB / Search/ Help/ Sample detail
|
Os06g0490400 |
blastp(Os)/ blastp(At)/ coex/// RAP/ RiceXPro/ SALAD/ ATTED-II |
|
Description : Similar to Peroxidase (EC 1.11.1.7).
|
|
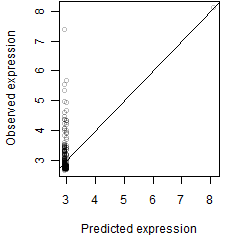
log2(Expression) ~ Norm(μ, σ2)
μ = α + β1D + β2C + β3E + β4D*C + β5D*E + γ1N8
|
_____ |
|

 __
__
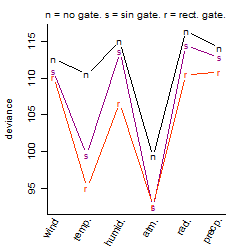
Dependence on each variable

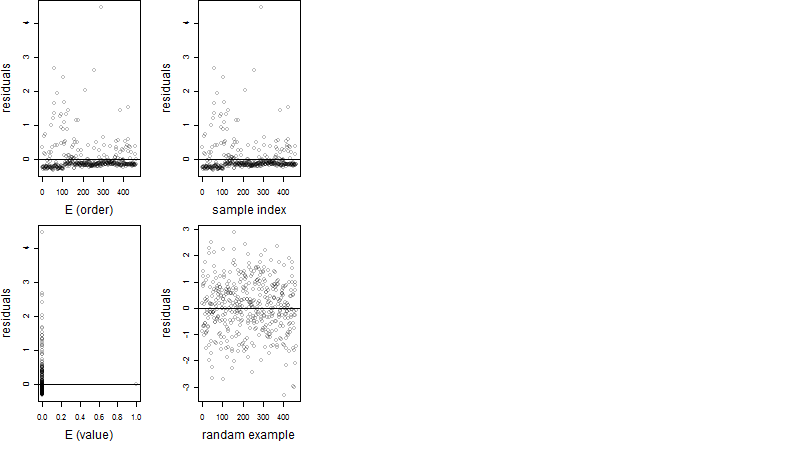
Residual plot
Process of the parameter reduction
(fixed parameters. wheather = atmosphere,
response mode = < th, dose dependency = dose dependent, type of G = no)
| deviance | σ | α | β1 | β2 | β3 | β4 | β5 | γ1 | peak time of C | threshold | memory length | peak or start time of G | open length of G |
|---|---|---|---|---|---|---|---|---|---|---|---|---|---|
| 99.21 | 0.464 | 3100 | -18900 | 0.0453 | 905000 | 0.356 | -5530000 | 0.0544 | 4.17 | 995 | 10 | -- | -- |
| 92.45 | 0.451 | 2.94 | -0.148 | 0.0345 | 5.25 | 0.335 | -- | 0.0524 | 3.61 | 994.8 | 10 | -- | -- |
| 99.51 | 0.465 | 3100 | -18900 | 0.0592 | 905000 | -- | -5530000 | 0.0525 | 6.33 | 995 | 10 | -- | -- |
| 92.75 | 0.451 | 2.94 | -0.153 | 0.0472 | 5.23 | -- | -- | 0.0503 | 5.95 | 994.8 | 19 | -- | -- |
| 99.69 | 0.465 | 3100 | -18900 | -- | 905000 | -- | -5530000 | 0.0534 | -- | 995 | 10 | -- | -- |
| 119.72 | 0.513 | 2.95 | -0.117 | 0.0174 | -- | -0.194 | -- | 0.0412 | 13.4 | -- | -- | -- | -- |
| 119.87 | 0.513 | 2.95 | -0.124 | 0.0187 | -- | -- | -- | 0.04 | 11.8 | -- | -- | -- | -- |
| 92.87 | 0.451 | 2.95 | -0.152 | -- | 5.21 | -- | -- | 0.0513 | -- | 994.8 | 19 | -- | -- |
| 93.37 | 0.453 | 2.94 | -- | 0.0448 | 5.21 | -- | -- | 0.0673 | 6.13 | 994.8 | 19 | -- | -- |
| 119.9 | 0.512 | 2.95 | -0.125 | -- | -- | -- | -- | 0.0398 | -- | -- | -- | -- | -- |
| 120.28 | 0.513 | 2.94 | -- | 0.0203 | -- | -- | -- | 0.0538 | 12.1 | -- | -- | -- | -- |
| 93.47 | 0.452 | 2.94 | -- | -- | 5.19 | -- | -- | 0.0681 | -- | 994.8 | 19 | -- | -- |
| 120.3 | 0.512 | 2.94 | -- | -- | -- | -- | -- | 0.0536 | -- | -- | -- | -- | -- |
Results of the grid search
Summarized heatmap of deviance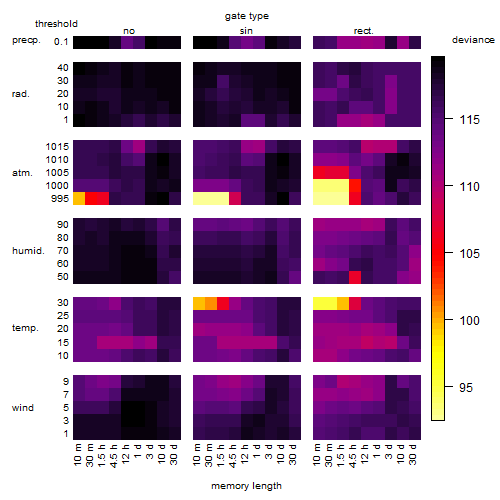
|
Histogram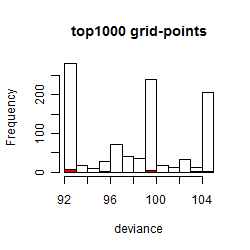 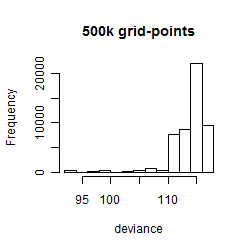
|
Local optima within top1000 grid-points
| rank | deviance | wheather | threshold | memory length | response mode | dose dependency | type of G | peak or start time of G | open length of G |
|---|---|---|---|---|---|---|---|---|---|
| 1 | 92.41 | atmosphere | 995 | 10 | > th | dose independent | sin | 6 | NA |
| 3 | 92.52 | atmosphere | 995 | 10 | < th | dose independent | sin | 6 | NA |
| 4 | 92.52 | atmosphere | 995 | 90 | < th | dose independent | rect. | 14 | 1 |
| 5 | 92.52 | atmosphere | 995 | 10 | < th | dose independent | rect. | 15 | 1 |
| 131 | 92.52 | atmosphere | 995 | 10 | < th | dose dependent | sin | 6 | NA |
| 133 | 92.52 | atmosphere | 995 | 90 | < th | dose dependent | rect. | 14 | 1 |
| 134 | 92.52 | atmosphere | 995 | 10 | < th | dose dependent | rect. | 15 | 1 |
| 309 | 95.01 | temperature | 30 | 30 | > th | dose dependent | rect. | 16 | 1 |
| 485 | 99.29 | atmosphere | 995 | 10 | < th | dose dependent | no | NA | NA |
| 698 | 99.53 | temperature | 30 | 10 | > th | dose dependent | sin | 12 | NA |
| 699 | 99.56 | atmosphere | 1000 | 10 | < th | dose independent | rect. | 1 | 1 |
| 706 | 99.56 | atmosphere | 1000 | 10 | < th | dose dependent | rect. | 1 | 1 |
| 792 | 103.75 | atmosphere | 995 | 30 | > th | dose independent | rect. | 21 | 23 |
| 822 | 104.40 | temperature | 30 | 30 | > th | dose independent | rect. | 16 | 1 |