Os06g0200800
blastp(Os)/ blastp(At)/ coex/// RAP/ RiceXPro/ SALAD/ ATTED-II
Description : Conserved hypothetical protein.
FiT-DB / Search/ Help/ Sample detail
|
Os06g0200800 |
blastp(Os)/ blastp(At)/ coex/// RAP/ RiceXPro/ SALAD/ ATTED-II |
|
Description : Conserved hypothetical protein.
|
|
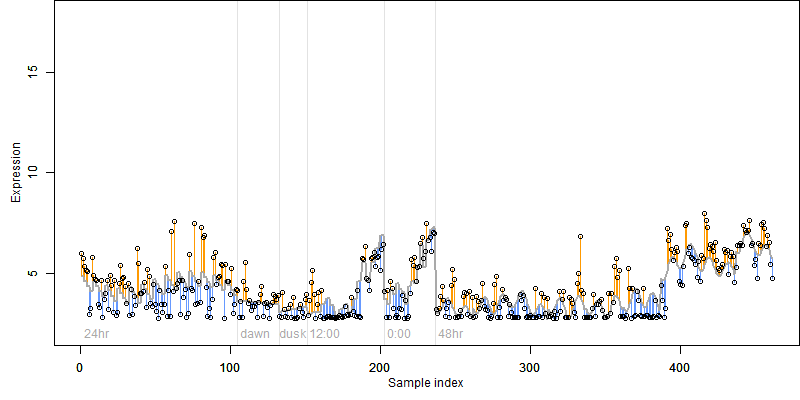
log2(Expression) ~ Norm(μ, σ2)
μ = α + β1D + β2C + β3E + β4D*C + β5D*E + γ1N8
|
_____ |
|

 __
__

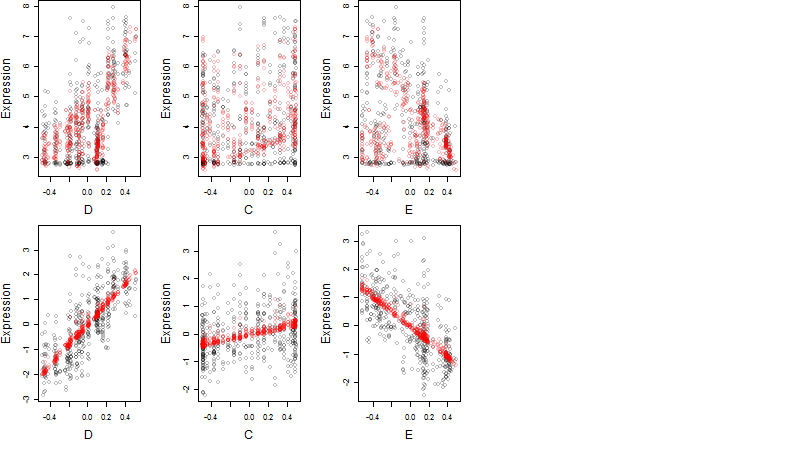
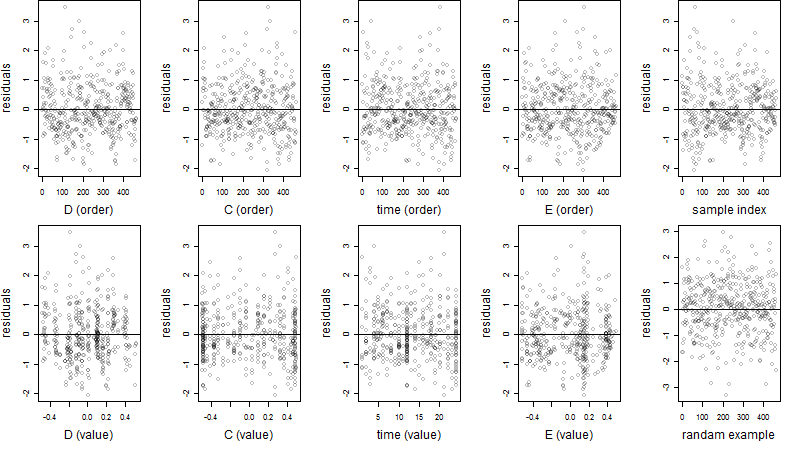
Dependence on each variable
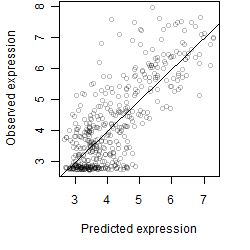
Residual plot
Process of the parameter reduction
(fixed parameters. wheather = temperature,
response mode = > th, dose dependency = dose dependent, type of G = no)
| deviance | σ | α | β1 | β2 | β3 | β4 | β5 | γ1 | peak time of C | threshold | memory length | peak or start time of G | open length of G |
|---|---|---|---|---|---|---|---|---|---|---|---|---|---|
| 316.78 | 0.836 | 3.85 | 4.62 | 0.737 | -2.73 | 1.81 | 1.49 | 1.29 | 0.437 | 21.08 | 1566 | -- | -- |
| 319.87 | 0.833 | 3.91 | 4.32 | 0.664 | -2.75 | 1.88 | -- | 1.24 | 0.047 | 20.46 | 1610 | -- | -- |
| 330.49 | 0.847 | 3.85 | 4.56 | 0.724 | -2.74 | -- | 1.58 | 1.28 | 0.6 | 21.17 | 1599 | -- | -- |
| 332.56 | 0.849 | 3.91 | 4.09 | 0.723 | -2.65 | -- | -- | 1.15 | 0.752 | 21.06 | 1595 | -- | -- |
| 362.49 | 0.887 | 3.84 | 4.62 | -- | -2.74 | -- | 1.68 | 1.3 | -- | 21.36 | 1638 | -- | -- |
| 547.92 | 1.1 | 4.05 | 3.2 | 0.661 | -- | 1.73 | -- | 0.537 | 0.4 | -- | -- | -- | -- |
| 560.34 | 1.11 | 4.05 | 3.13 | 0.666 | -- | -- | -- | 0.526 | 0.987 | -- | -- | -- | -- |
| 364.59 | 0.889 | 3.9 | 4.13 | -- | -2.67 | -- | -- | 1.16 | -- | 20.86 | 1641 | -- | -- |
| 726.99 | 1.26 | 4.08 | -- | 0.984 | -1.58 | -- | -- | 0.466 | 1.42 | 22.2 | 1315 | -- | -- |
| 587.92 | 1.13 | 4.04 | 3.15 | -- | -- | -- | -- | 0.539 | -- | -- | -- | -- | -- |
| 818.54 | 1.34 | 4.13 | -- | 0.718 | -- | -- | -- | 0.177 | 1.17 | -- | -- | -- | -- |
| 733.75 | 1.27 | 4.05 | -- | -- | -2.16 | -- | -- | 0.488 | -- | 20.86 | 1641 | -- | -- |
| 850.47 | 1.36 | 4.12 | -- | -- | -- | -- | -- | 0.189 | -- | -- | -- | -- | -- |
Results of the grid search
Summarized heatmap of deviance
|
Histogram 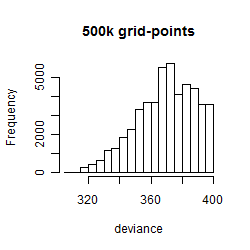
|
Local optima within top1000 grid-points
| rank | deviance | wheather | threshold | memory length | response mode | dose dependency | type of G | peak or start time of G | open length of G |
|---|---|---|---|---|---|---|---|---|---|
| 1 | 307.94 | wind | 9.0 | 43200 | > th | dose dependent | rect. | 19 | 11 |
| 5 | 313.55 | wind | 9.0 | 43200 | > th | dose independent | rect. | 19 | 11 |
| 7 | 315.30 | temperature | 20.0 | 1440 | > th | dose dependent | rect. | 6 | 15 |
| 9 | 315.41 | temperature | 20.0 | 1440 | > th | dose dependent | sin | 20 | NA |
| 19 | 315.68 | temperature | 20.0 | 1440 | > th | dose dependent | rect. | 10 | 12 |
| 44 | 316.19 | temperature | 20.0 | 1440 | > th | dose dependent | rect. | 13 | 9 |
| 71 | 316.68 | temperature | 20.0 | 1440 | > th | dose dependent | rect. | 16 | 3 |
| 79 | 316.98 | wind | 9.0 | 43200 | < th | dose independent | rect. | 19 | 11 |
| 106 | 317.50 | temperature | 20.0 | 1440 | > th | dose dependent | rect. | 15 | 5 |
| 188 | 319.35 | temperature | 20.0 | 1440 | > th | dose dependent | rect. | 10 | 23 |
| 190 | 319.40 | temperature | 20.0 | 1440 | > th | dose dependent | no | NA | NA |
| 197 | 319.57 | temperature | 20.0 | 1440 | > th | dose dependent | rect. | 13 | 23 |
| 202 | 319.67 | wind | 9.0 | 43200 | > th | dose dependent | rect. | 19 | 6 |
| 224 | 319.89 | precipitation | 0.1 | 43200 | < th | dose independent | rect. | 17 | 1 |
| 226 | 319.89 | precipitation | 0.1 | 43200 | < th | dose dependent | rect. | 17 | 1 |
| 246 | 320.04 | precipitation | 0.1 | 43200 | > th | dose independent | rect. | 17 | 1 |
| 281 | 320.35 | wind | 9.0 | 43200 | > th | dose independent | rect. | 19 | 6 |
| 283 | 320.35 | temperature | 20.0 | 1440 | > th | dose dependent | rect. | 16 | 23 |
| 478 | 322.62 | wind | 9.0 | 43200 | < th | dose independent | rect. | 19 | 6 |
| 479 | 322.63 | temperature | 30.0 | 1440 | < th | dose dependent | rect. | 18 | 1 |
| 688 | 325.35 | radiation | 20.0 | 4320 | < th | dose independent | rect. | 15 | 17 |
| 724 | 325.70 | wind | 9.0 | 43200 | > th | dose independent | rect. | 19 | 3 |
| 894 | 327.28 | wind | 9.0 | 43200 | < th | dose independent | rect. | 19 | 2 |