Os05g0459000
blastp(Os)/ blastp(At)/ coex/// RAP/ RiceXPro/ SALAD/ ATTED-II
Description : Similar to Gag/env/c-myb protein (Fragment).

FiT-DB / Search/ Help/ Sample detail
|
Os05g0459000 |
blastp(Os)/ blastp(At)/ coex/// RAP/ RiceXPro/ SALAD/ ATTED-II |
|
Description : Similar to Gag/env/c-myb protein (Fragment).
|
|
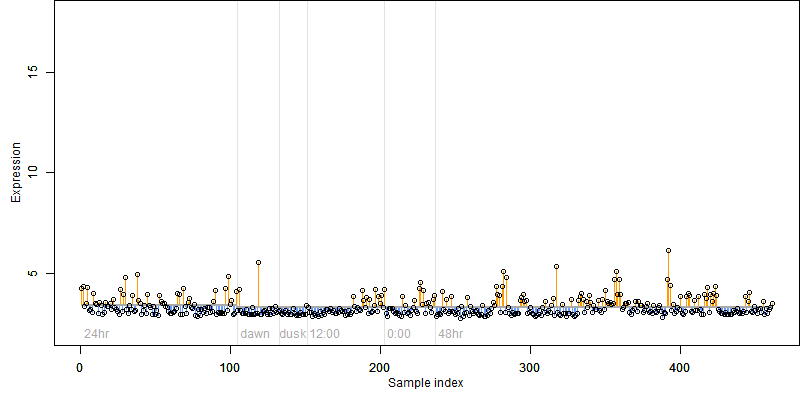
log2(Expression) ~ Norm(μ, σ2)
μ = α + β1D + β2C + β3E + β4D*C + β5D*E + γ1N8
|
_____ |
|

 __
__
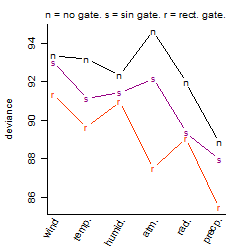
Dependence on each variable

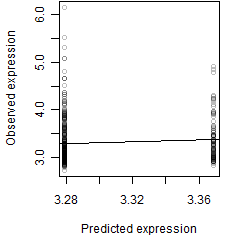
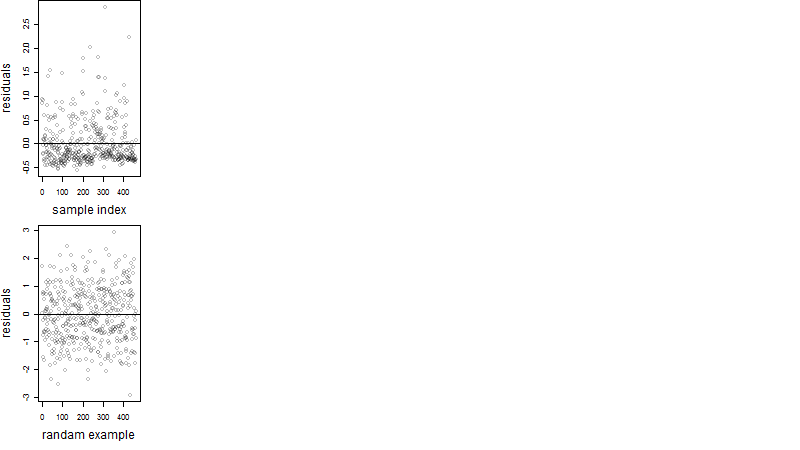
Residual plot
Process of the parameter reduction
(fixed parameters. wheather = precipitation,
response mode = > th, dose dependency = dose independent, type of G = no)
| deviance | σ | α | β1 | β2 | β3 | β4 | β5 | γ1 | peak time of C | threshold | memory length | peak or start time of G | open length of G |
|---|---|---|---|---|---|---|---|---|---|---|---|---|---|
| 86.02 | 0.436 | 3.3 | 0.0741 | 0.122 | 5.79 | 0.237 | -17 | 0.13 | 5.44 | 1.5 | 295 | -- | -- |
| 87.14 | 0.435 | 3.26 | 0.279 | 0.112 | 2.37 | -0.116 | -- | 0.128 | 3.29 | 1.505 | 275 | -- | -- |
| 86.07 | 0.432 | 3.3 | 0.0838 | 0.123 | 5.82 | -- | -16.8 | 0.133 | 4.89 | 1.505 | 294 | -- | -- |
| 86.62 | 0.433 | 3.27 | 0.216 | 0.125 | 2.12 | -- | -- | 0.126 | 4.06 | 1.5 | 231 | -- | -- |
| 86.89 | 0.434 | 3.3 | 0.0754 | -- | 6.09 | -- | -18.4 | 0.132 | -- | 1.563 | 294 | -- | -- |
| 96.5 | 0.461 | 3.27 | 0.264 | 0.0963 | -- | -0.0387 | -- | 0.117 | 2.77 | -- | -- | -- | -- |
| 96.51 | 0.46 | 3.27 | 0.265 | 0.0963 | -- | -- | -- | 0.117 | 2.83 | -- | -- | -- | -- |
| 87.48 | 0.436 | 3.27 | 0.224 | -- | 2.06 | -- | -- | 0.13 | -- | 1.722 | 229 | -- | -- |
| 87.86 | 0.437 | 3.27 | -- | 0.133 | 2.17 | -- | -- | 0.103 | 4.37 | 1.661 | 248 | -- | -- |
| 97.05 | 0.46 | 3.27 | 0.269 | -- | -- | -- | -- | 0.119 | -- | -- | -- | -- | -- |
| 98.35 | 0.464 | 3.28 | -- | 0.102 | -- | -- | -- | 0.0873 | 2.85 | -- | -- | -- | -- |
| 88.8 | 0.439 | 3.28 | -- | -- | 2.12 | -- | -- | 0.106 | -- | 1.803 | 243 | -- | -- |
| 98.95 | 0.464 | 3.28 | -- | -- | -- | -- | -- | 0.0894 | -- | -- | -- | -- | -- |
Results of the grid search
Summarized heatmap of deviance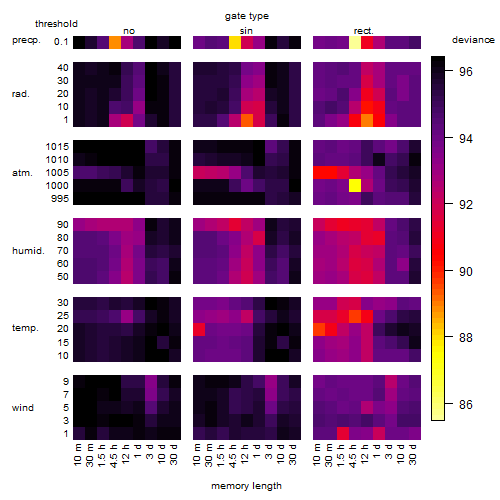
|
Histogram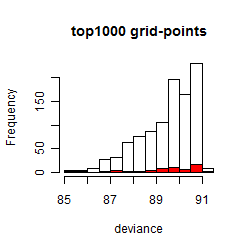 
|
Local optima within top1000 grid-points
| rank | deviance | wheather | threshold | memory length | response mode | dose dependency | type of G | peak or start time of G | open length of G |
|---|---|---|---|---|---|---|---|---|---|
| 1 | 85.47 | precipitation | 0.1 | 270 | > th | dose independent | rect. | 16 | 3 |
| 4 | 85.93 | precipitation | 0.1 | 270 | > th | dose dependent | rect. | 15 | 4 |
| 31 | 86.90 | precipitation | 0.1 | 270 | > th | dose dependent | rect. | 15 | 13 |
| 33 | 86.92 | precipitation | 0.1 | 270 | > th | dose dependent | rect. | 2 | 17 |
| 50 | 87.14 | precipitation | 0.1 | 270 | > th | dose dependent | rect. | 21 | 22 |
| 68 | 87.47 | atmosphere | 1000.0 | 270 | < th | dose independent | rect. | 16 | 1 |
| 69 | 87.48 | atmosphere | 1000.0 | 270 | < th | dose dependent | rect. | 16 | 1 |
| 105 | 87.73 | precipitation | 0.1 | 270 | > th | dose dependent | rect. | 8 | 11 |
| 127 | 87.95 | precipitation | 0.1 | 270 | > th | dose dependent | sin | 18 | NA |
| 158 | 88.22 | precipitation | 0.1 | 270 | > th | dose independent | rect. | 15 | 13 |
| 198 | 88.43 | precipitation | 0.1 | 270 | > th | dose independent | rect. | 4 | 14 |
| 224 | 88.57 | precipitation | 0.1 | 270 | > th | dose dependent | rect. | 6 | 22 |
| 271 | 88.83 | precipitation | 0.1 | 270 | > th | dose dependent | no | NA | NA |
| 292 | 88.96 | precipitation | 0.1 | 270 | > th | dose independent | rect. | 2 | 17 |
| 297 | 89.04 | radiation | 1.0 | 720 | < th | dose independent | rect. | 13 | 10 |
| 300 | 89.08 | radiation | 1.0 | 720 | < th | dose independent | rect. | 9 | 14 |
| 327 | 89.33 | radiation | 1.0 | 720 | > th | dose independent | rect. | 7 | 12 |
| 339 | 89.35 | radiation | 1.0 | 720 | < th | dose independent | sin | 18 | NA |
| 359 | 89.41 | radiation | 1.0 | 720 | > th | dose independent | rect. | 9 | 10 |
| 376 | 89.44 | radiation | 1.0 | 720 | > th | dose independent | sin | 18 | NA |
| 392 | 89.48 | precipitation | 0.1 | 270 | > th | dose independent | sin | 16 | NA |
| 456 | 89.62 | precipitation | 0.1 | 270 | < th | dose independent | sin | 19 | NA |
| 458 | 89.62 | precipitation | 0.1 | 270 | < th | dose dependent | sin | 19 | NA |
| 463 | 89.63 | temperature | 20.0 | 10 | < th | dose independent | rect. | 17 | 5 |
| 469 | 89.65 | radiation | 1.0 | 720 | > th | dose independent | rect. | 15 | 4 |
| 488 | 89.68 | temperature | 25.0 | 270 | < th | dose dependent | rect. | 17 | 3 |
| 500 | 89.74 | radiation | 1.0 | 720 | < th | dose dependent | rect. | 9 | 14 |
| 521 | 89.79 | radiation | 1.0 | 720 | < th | dose dependent | rect. | 9 | 17 |
| 529 | 89.81 | radiation | 1.0 | 720 | < th | dose dependent | rect. | 13 | 10 |
| 542 | 89.85 | temperature | 20.0 | 10 | < th | dose independent | rect. | 19 | 3 |
| 555 | 89.87 | radiation | 1.0 | 720 | < th | dose dependent | sin | 20 | NA |
| 560 | 89.91 | radiation | 1.0 | 720 | < th | dose dependent | rect. | 9 | 9 |
| 649 | 90.24 | radiation | 1.0 | 720 | > th | dose independent | rect. | 13 | 6 |
| 662 | 90.26 | radiation | 1.0 | 720 | < th | dose independent | rect. | 9 | 9 |
| 677 | 90.31 | atmosphere | 1005.0 | 10 | > th | dose independent | rect. | 15 | 15 |
| 678 | 90.32 | radiation | 1.0 | 720 | < th | dose independent | rect. | 14 | 1 |
| 694 | 90.32 | radiation | 1.0 | 720 | < th | dose dependent | rect. | 14 | 1 |
| 766 | 90.52 | precipitation | 0.1 | 270 | > th | dose independent | rect. | 6 | 22 |
| 782 | 90.58 | radiation | 1.0 | 1440 | < th | dose independent | rect. | 9 | 2 |
| 783 | 90.58 | radiation | 1.0 | 720 | < th | dose independent | rect. | 9 | 20 |
| 786 | 90.58 | radiation | 1.0 | 1440 | < th | dose dependent | rect. | 9 | 2 |
| 795 | 90.61 | radiation | 1.0 | 720 | < th | dose independent | rect. | 11 | 19 |
| 882 | 90.79 | precipitation | 0.1 | 270 | > th | dose independent | no | NA | NA |
| 883 | 90.79 | precipitation | 0.1 | 270 | < th | dose independent | no | NA | NA |
| 893 | 90.79 | precipitation | 0.1 | 270 | < th | dose dependent | no | NA | NA |
| 904 | 90.84 | atmosphere | 1005.0 | 10 | < th | dose independent | rect. | 18 | 13 |
| 934 | 90.90 | atmosphere | 1005.0 | 10 | > th | dose independent | rect. | 18 | 12 |
| 940 | 90.91 | radiation | 1.0 | 1440 | > th | dose independent | rect. | 11 | 5 |
| 958 | 90.94 | precipitation | 0.1 | 270 | > th | dose independent | sin | 0 | NA |
| 959 | 90.94 | temperature | 25.0 | 720 | > th | dose independent | rect. | 17 | 1 |
| 961 | 90.94 | radiation | 1.0 | 720 | < th | dose independent | rect. | 3 | 23 |
| 976 | 90.96 | humidity | 90.0 | 90 | > th | dose dependent | rect. | 5 | 21 |
| 989 | 90.99 | radiation | 1.0 | 720 | < th | dose dependent | rect. | 9 | 20 |
| 995 | 91.01 | radiation | 1.0 | 1440 | > th | dose independent | rect. | 9 | 6 |
| 997 | 91.02 | temperature | 25.0 | 270 | < th | dose independent | rect. | 17 | 2 |