FiT-DB /
Search/
Help/
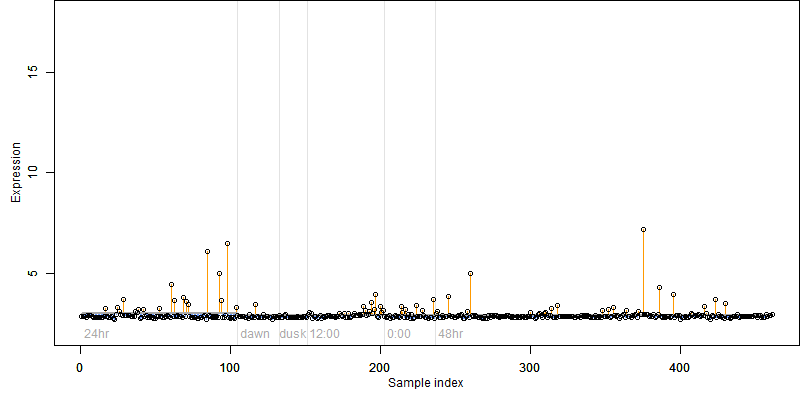
Sample detail
Notice!
This gene did NOT pass the analysis criteria
(log2(expression) > 5 in more than 80% of samples &
normality of residuals was not rejected).
The modeling results may be unreliable.
|
Os05g0208100
|
blastp(Os)/
blastp(At)/
coex///
RAP/
RiceXPro/
SALAD/
ATTED-II
|
|
Description : Similar to CBL-interacting serine/threonine-protein kinase 15 (EC 2.7.1.37) (Serine/threonine-protein kinase ATPK10) (SOS2-like protein kinase PKS3) (SOS-interacting protein 2) (SNF1-related kinase 3.1).

|
log2(Expression) ~
Norm(μ, σ2)
μ = α
+ β1D
+ β2C
+ β3E
+ β4D*C
+ β5D*E
+ γ1N8
| par. |
|
value |
(S.E.) |
|
|
|
|
|
|
| α |
: |
2.9 |
(0.0204) |
R2 |
: |
0.0105 |
|
|
|
| β1 |
: |
-- |
(--) |
R2dD |
: |
-- |
R2D |
: |
-- |
| β2 |
: |
-- |
(--) |
R2dC |
: |
-- |
R2C |
: |
-- |
| β3 |
: |
-- |
(--) |
R2dE |
: |
-- |
R2E |
: |
-- |
| β4 |
: |
-- |
(--) |
R2dD*C |
: |
-- |
R2D*C |
: |
-- |
| β5 |
: |
-- |
(--) |
R2dD*E |
: |
-- |
R2D*E |
: |
-- |
| γ1 |
: |
0.0945 |
(0.0429) |
R2dN8 |
: |
0.0136 |
R2N8 |
: |
0.0105 |
| σ |
: |
0.384 |
|
|
|
|
|
|
|
| deviance |
: |
67.74 |
|
|
|
|
|
|
|
| __ |
|
|
|
|
|
|
|
|
|
|
_____
|
| C |
|
|
| peak time of C |
: |
-- |
| E |
|
|
| wheather |
: |
-- |
| threshold |
: |
-- |
| memory length |
: |
-- |
| response mode |
: |
-- |
| dose dependency |
: |
-- |
| G |
|
|
| type of G |
: |
-- |
| peak or start time of G |
: |
-- |
| open length of G |
: |
-- |
|

 __
__
Dependence on each variable

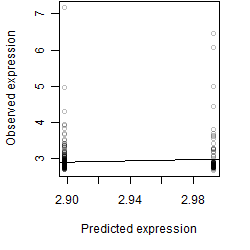
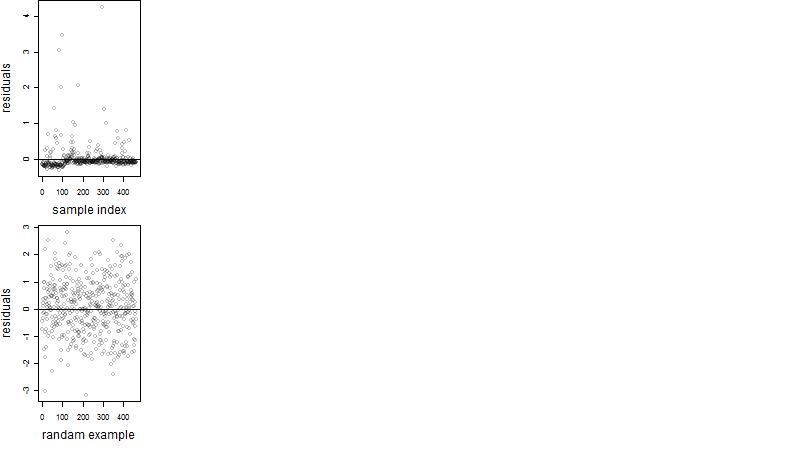
Residual plot
Process of the parameter reduction
(fixed parameters. wheather = temperature,
response mode = > th, dose dependency = dose dependent, type of G = no)
| deviance | σ | α | β1 | β2 | β3 | β4 | β5 | γ1 | peak time of C | threshold | memory length | peak or start time of G | open length of G |
| 64.1 |
0.376 |
2.84 |
0.515 |
0.0903 |
-1.76 |
-0.195 |
17.6 |
0.106 |
5.64 |
31 |
35 |
-- |
-- |
| 66.25 |
0.382 |
2.89 |
0.0572 |
0.0957 |
0.371 |
-0.222 |
-- |
0.11 |
5.45 |
31 |
35 |
-- |
-- |
| 64.11 |
0.373 |
2.84 |
0.516 |
0.097 |
-1.8 |
-- |
18 |
0.106 |
7.14 |
31.06 |
34 |
-- |
-- |
| 66.25 |
0.379 |
2.89 |
0.0617 |
0.107 |
0.375 |
-- |
-- |
0.112 |
7.04 |
31.1 |
15 |
-- |
-- |
| 64.6 |
0.374 |
2.84 |
0.522 |
-- |
-1.86 |
-- |
18.2 |
0.105 |
-- |
31.08 |
32 |
-- |
-- |
| 67.03 |
0.384 |
2.9 |
0.0642 |
0.0619 |
-- |
0.281 |
-- |
0.102 |
11.1 |
-- |
-- |
-- |
-- |
| 67.17 |
0.384 |
2.89 |
0.0735 |
0.0876 |
-- |
-- |
-- |
0.102 |
8.13 |
-- |
-- |
-- |
-- |
| 66.82 |
0.381 |
2.89 |
0.0631 |
-- |
0.355 |
-- |
-- |
0.112 |
-- |
31.48 |
15 |
-- |
-- |
| 66.34 |
0.379 |
2.89 |
-- |
0.107 |
0.384 |
-- |
-- |
0.105 |
6.94 |
31.04 |
15 |
-- |
-- |
| 67.59 |
0.384 |
2.9 |
0.0742 |
-- |
-- |
-- |
-- |
0.103 |
-- |
-- |
-- |
-- |
-- |
| 67.31 |
0.384 |
2.9 |
-- |
0.088 |
-- |
-- |
-- |
0.0935 |
8.06 |
-- |
-- |
-- |
-- |
| 66.92 |
0.381 |
2.9 |
-- |
-- |
0.362 |
-- |
-- |
0.105 |
-- |
31.45 |
15 |
-- |
-- |
| 67.74 |
0.384 |
2.9 |
-- |
-- |
-- |
-- |
-- |
0.0945 |
-- |
-- |
-- |
-- |
-- |
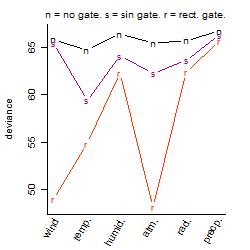
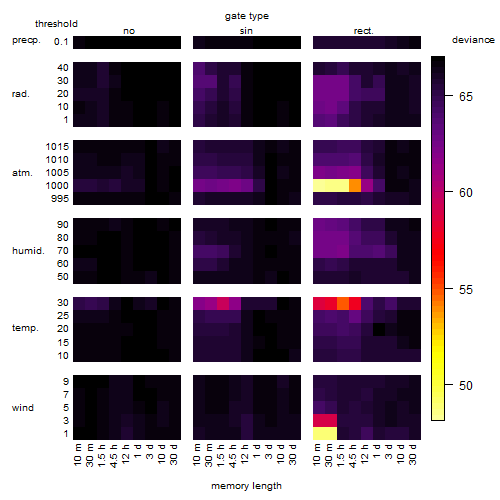
Results of the grid search
Summarized heatmap of deviance
|
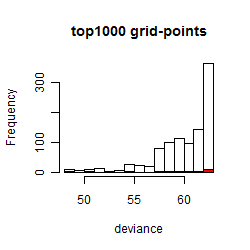
Histogram

|
Local optima within top1000 grid-points
| rank |
deviance |
wheather |
threshold |
memory length |
response mode |
dose dependency |
type of G |
peak or start time of G |
open length of G |
| 1 |
48.13 |
atmosphere |
1000 |
10 |
< th |
dose dependent |
rect. |
10 |
2 |
| 3 |
48.54 |
atmosphere |
1000 |
90 |
< th |
dose dependent |
rect. |
10 |
1 |
| 7 |
48.97 |
wind |
1 |
10 |
< th |
dose independent |
rect. |
12 |
1 |
| 9 |
48.97 |
wind |
1 |
10 |
< th |
dose dependent |
rect. |
12 |
1 |
| 18 |
50.37 |
atmosphere |
1000 |
10 |
< th |
dose independent |
rect. |
10 |
2 |
| 20 |
50.44 |
atmosphere |
1000 |
90 |
< th |
dose independent |
rect. |
10 |
1 |
| 65 |
54.80 |
temperature |
30 |
90 |
> th |
dose dependent |
rect. |
10 |
1 |
| 154 |
57.91 |
atmosphere |
1000 |
10 |
< th |
dose dependent |
rect. |
6 |
7 |
| 157 |
57.93 |
temperature |
30 |
270 |
> th |
dose dependent |
rect. |
8 |
1 |
| 173 |
58.00 |
temperature |
30 |
270 |
> th |
dose independent |
rect. |
8 |
1 |
| 197 |
58.27 |
temperature |
30 |
90 |
> th |
dose independent |
rect. |
10 |
1 |
| 341 |
59.37 |
temperature |
30 |
90 |
> th |
dose dependent |
sin |
9 |
NA |
| 415 |
60.18 |
atmosphere |
1000 |
10 |
< th |
dose independent |
rect. |
6 |
7 |
| 525 |
61.35 |
atmosphere |
1000 |
720 |
> th |
dose independent |
rect. |
3 |
8 |
| 528 |
61.36 |
atmosphere |
1000 |
720 |
< th |
dose independent |
rect. |
24 |
12 |
| 552 |
61.61 |
temperature |
30 |
270 |
> th |
dose independent |
sin |
9 |
NA |
| 575 |
61.76 |
atmosphere |
1000 |
10 |
< th |
dose dependent |
rect. |
2 |
11 |
| 683 |
62.22 |
temperature |
30 |
270 |
< th |
dose independent |
sin |
9 |
NA |
| 694 |
62.25 |
atmosphere |
1000 |
270 |
> th |
dose independent |
sin |
3 |
NA |
| 717 |
62.30 |
humidity |
70 |
90 |
< th |
dose dependent |
rect. |
18 |
14 |
| 718 |
62.31 |
humidity |
70 |
30 |
< th |
dose independent |
rect. |
18 |
14 |
| 727 |
62.33 |
humidity |
80 |
10 |
< th |
dose dependent |
rect. |
7 |
1 |
| 780 |
62.37 |
radiation |
30 |
10 |
> th |
dose dependent |
rect. |
7 |
1 |
| 804 |
62.38 |
radiation |
30 |
10 |
> th |
dose independent |
rect. |
7 |
1 |
| 807 |
62.38 |
humidity |
80 |
90 |
< th |
dose independent |
rect. |
5 |
2 |
| 960 |
62.40 |
humidity |
70 |
10 |
< th |
dose independent |
rect. |
7 |
1 |