Os04g0688200
blastp(Os)/ blastp(At)/ coex/// RAP/ RiceXPro/ SALAD/ ATTED-II
Description : Similar to Peroxidase (EC 1.11.1.7).


FiT-DB / Search/ Help/ Sample detail
|
Os04g0688200 |
blastp(Os)/ blastp(At)/ coex/// RAP/ RiceXPro/ SALAD/ ATTED-II |
|
Description : Similar to Peroxidase (EC 1.11.1.7).
|
|
log2(Expression) ~ Norm(μ, σ2)
μ = α + β1D + β2C + β3E + β4D*C + β5D*E + γ1N8
|
_____ |
|

 __
__
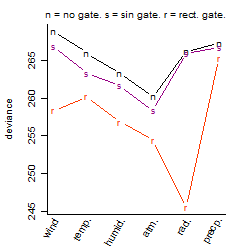
Dependence on each variable

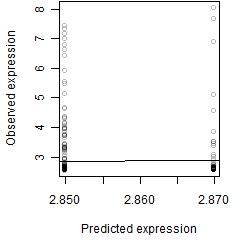
Residual plot

Process of the parameter reduction
(fixed parameters. wheather = atmosphere,
response mode = < th, dose dependency = dose independent, type of G = no)
| deviance | σ | α | β1 | β2 | β3 | β4 | β5 | γ1 | peak time of C | threshold | memory length | peak or start time of G | open length of G |
|---|---|---|---|---|---|---|---|---|---|---|---|---|---|
| 259.37 | 0.757 | 2.85 | -0.131 | 0.0166 | -0.574 | -0.608 | -1.18 | 0.0646 | 2.78 | 1015 | 4798 | -- | -- |
| 264.37 | 0.757 | 2.83 | 0.0857 | 0.0291 | -0.614 | -0.629 | -- | 0.113 | 2.78 | 1014 | 4774 | -- | -- |
| 260.46 | 0.752 | 2.85 | -0.134 | 0.0458 | -0.578 | -- | -1.24 | 0.0386 | 7.15 | 1015 | 4792 | -- | -- |
| 265.38 | 0.759 | 2.83 | 0.102 | 0.0719 | -0.618 | -- | -- | 0.117 | 7.35 | 1014 | 4784 | -- | -- |
| 260.65 | 0.752 | 2.85 | -0.132 | -- | -0.575 | -- | -1.26 | 0.0481 | -- | 1015 | 4792 | -- | -- |
| 277.61 | 0.781 | 2.85 | 0.0469 | 0.0174 | -- | -0.582 | -- | 0.0228 | 3.12 | -- | -- | -- | -- |
| 278.58 | 0.782 | 2.85 | 0.059 | 0.0539 | -- | -- | -- | 0.0258 | 7.68 | -- | -- | -- | -- |
| 265.63 | 0.759 | 2.83 | 0.101 | -- | -0.618 | -- | -- | 0.12 | -- | 1014 | 4784 | -- | -- |
| 265.64 | 0.759 | 2.83 | -- | 0.0705 | -0.615 | -- | -- | 0.108 | 7.16 | 1014 | 4784 | -- | -- |
| 278.73 | 0.78 | 2.85 | 0.0597 | -- | -- | -- | -- | 0.0266 | -- | -- | -- | -- | -- |
| 278.67 | 0.781 | 2.85 | -- | 0.0543 | -- | -- | -- | 0.0192 | 7.6 | -- | -- | -- | -- |
| 265.9 | 0.759 | 2.83 | -- | -- | -0.613 | -- | -- | 0.108 | -- | 1014 | 4784 | -- | -- |
| 278.83 | 0.779 | 2.85 | -- | -- | -- | -- | -- | 0.02 | -- | -- | -- | -- | -- |
Results of the grid search
Summarized heatmap of deviance
|
Histogram 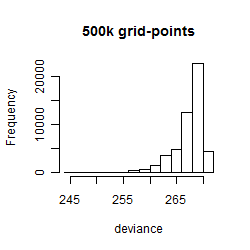
|
Local optima within top1000 grid-points
| rank | deviance | wheather | threshold | memory length | response mode | dose dependency | type of G | peak or start time of G | open length of G |
|---|---|---|---|---|---|---|---|---|---|
| 1 | 245.54 | radiation | 10 | 10 | < th | dose independent | rect. | 11 | 3 |
| 9 | 246.98 | radiation | 10 | 90 | < th | dose dependent | rect. | 11 | 2 |
| 29 | 252.06 | radiation | 10 | 30 | < th | dose independent | rect. | 8 | 7 |
| 54 | 254.45 | atmosphere | 1015 | 1440 | < th | dose independent | rect. | 14 | 5 |
| 57 | 254.56 | atmosphere | 1015 | 1440 | < th | dose independent | rect. | 14 | 3 |
| 58 | 254.58 | atmosphere | 1015 | 1440 | > th | dose independent | rect. | 14 | 1 |
| 64 | 254.58 | atmosphere | 1015 | 1440 | > th | dose dependent | rect. | 14 | 1 |
| 84 | 256.38 | atmosphere | 1010 | 720 | > th | dose dependent | rect. | 2 | 1 |
| 87 | 256.85 | humidity | 50 | 10 | < th | dose independent | rect. | 11 | 1 |
| 179 | 256.85 | humidity | 50 | 10 | < th | dose dependent | rect. | 11 | 1 |
| 271 | 257.09 | atmosphere | 1015 | 4320 | > th | dose dependent | rect. | 4 | 1 |
| 272 | 257.10 | atmosphere | 1015 | 4320 | > th | dose independent | rect. | 4 | 1 |
| 278 | 257.13 | atmosphere | 1015 | 4320 | < th | dose independent | rect. | 5 | 1 |
| 280 | 257.18 | atmosphere | 1015 | 4320 | < th | dose independent | rect. | 4 | 3 |
| 329 | 257.87 | atmosphere | 1015 | 4320 | > th | dose dependent | rect. | 7 | 1 |
| 335 | 257.93 | atmosphere | 1015 | 4320 | > th | dose dependent | rect. | 4 | 14 |
| 347 | 258.02 | atmosphere | 1015 | 4320 | > th | dose independent | rect. | 4 | 15 |
| 370 | 258.10 | atmosphere | 1015 | 4320 | < th | dose independent | rect. | 4 | 15 |
| 437 | 258.39 | atmosphere | 1015 | 4320 | > th | dose dependent | sin | 1 | NA |
| 440 | 258.42 | wind | 1 | 90 | < th | dose independent | rect. | 24 | 4 |
| 540 | 258.82 | atmosphere | 1015 | 4320 | > th | dose independent | sin | 1 | NA |
| 564 | 258.89 | atmosphere | 1015 | 4320 | < th | dose independent | sin | 1 | NA |
| 570 | 258.90 | atmosphere | 1015 | 4320 | > th | dose dependent | rect. | 9 | 1 |
| 772 | 259.70 | atmosphere | 1015 | 4320 | > th | dose independent | rect. | 11 | 3 |
| 794 | 259.76 | atmosphere | 1015 | 4320 | < th | dose independent | rect. | 11 | 3 |
| 952 | 260.19 | atmosphere | 1015 | 4320 | > th | dose dependent | no | NA | NA |
| 953 | 260.19 | temperature | 20 | 4320 | < th | dose dependent | rect. | 5 | 1 |
| 962 | 260.19 | atmosphere | 1015 | 4320 | > th | dose dependent | rect. | 16 | 23 |