Os04g0664500
blastp(Os)/ blastp(At)/ coex/// RAP/ RiceXPro/ SALAD/ ATTED-II
Description : Similar to Agmatine coumaroyltransferase.
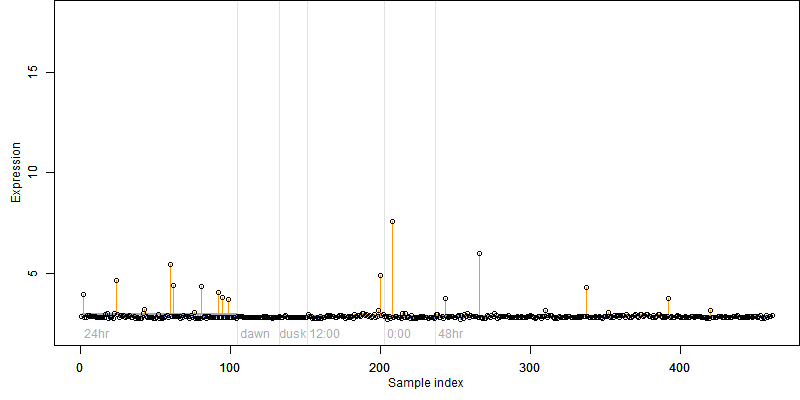

FiT-DB / Search/ Help/ Sample detail
|
Os04g0664500 |
blastp(Os)/ blastp(At)/ coex/// RAP/ RiceXPro/ SALAD/ ATTED-II |
|
Description : Similar to Agmatine coumaroyltransferase.
|
|
log2(Expression) ~ Norm(μ, σ2)
μ = α + β1D + β2C + β3E + β4D*C + β5D*E + γ1N8
|
_____ |
|
 __
__
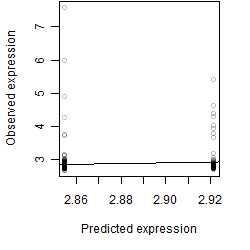
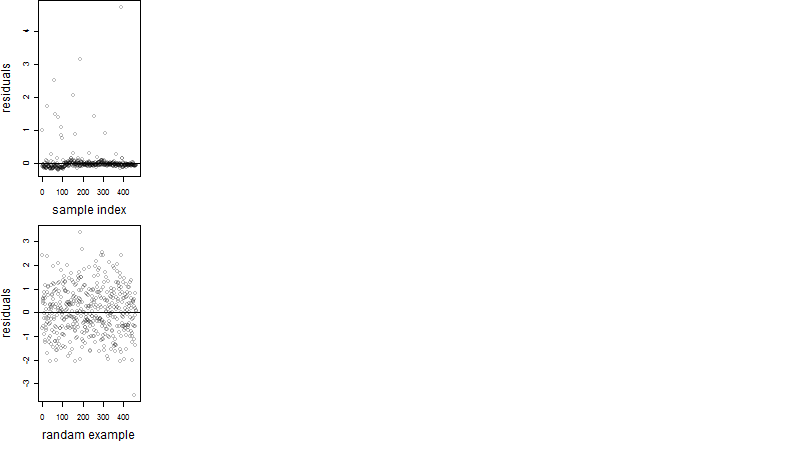
Dependence on each variable

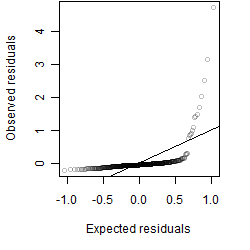
Residual plot
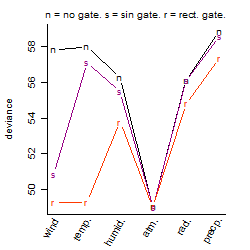
Process of the parameter reduction
(fixed parameters. wheather = atmosphere,
response mode = > th, dose dependency = dose independent, type of G = no)
| deviance | σ | α | β1 | β2 | β3 | β4 | β5 | γ1 | peak time of C | threshold | memory length | peak or start time of G | open length of G |
|---|---|---|---|---|---|---|---|---|---|---|---|---|---|
| 49.03 | 0.326 | 2.85 | -0.0388 | 0.0179 | 1.2 | 0.294 | -3.09 | 0.0788 | 9.73 | 1015 | 10 | -- | -- |
| 54 | 0.345 | 2.85 | -0.0847 | 0.0228 | 1.14 | 0.482 | -- | 0.0709 | 10.6 | 1015 | 10 | -- | -- |
| 49.32 | 0.33 | 2.85 | -0.0249 | 0.0283 | 1.2 | -- | -3.22 | 0.0803 | 13.7 | 1015 | 10 | -- | -- |
| 53.92 | 0.342 | 2.86 | -0.0372 | 0.029 | 1.2 | -- | -- | 0.0682 | 11.8 | 1014 | 334 | -- | -- |
| 49.37 | 0.329 | 2.85 | -0.0261 | -- | 1.19 | -- | -3.22 | 0.0795 | -- | 1015 | 10 | -- | -- |
| 59.01 | 0.36 | 2.86 | -0.0853 | 0.0138 | -- | -0.473 | -- | 0.0581 | 22.4 | -- | -- | -- | -- |
| 59.92 | 0.363 | 2.86 | -0.0662 | 0.0176 | -- | -- | -- | 0.0595 | 21.1 | -- | -- | -- | -- |
| 49.82 | 0.329 | 2.86 | 0.0744 | -- | 1.98 | -- | -- | 0.0698 | -- | 1016 | 63 | -- | -- |
| 49.33 | 0.327 | 2.85 | -- | 0.0281 | 2.33 | -- | -- | 0.0805 | 12.7 | 1016 | 249 | -- | -- |
| 59.94 | 0.362 | 2.86 | -0.0661 | -- | -- | -- | -- | 0.0594 | -- | -- | -- | -- | -- |
| 60.04 | 0.362 | 2.86 | -- | 0.0178 | -- | -- | -- | 0.0669 | 20.8 | -- | -- | -- | -- |
| 49.38 | 0.327 | 2.85 | -- | -- | 2.33 | -- | -- | 0.08 | -- | 1016 | 341 | -- | -- |
| 60.05 | 0.362 | 2.85 | -- | -- | -- | -- | -- | 0.0667 | -- | -- | -- | -- | -- |
Results of the grid search
Summarized heatmap of deviance
|
Histogram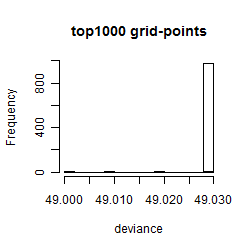 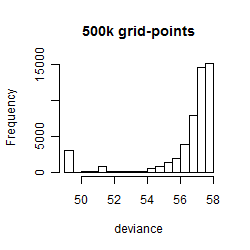
|
Local optima within top1000 grid-points
| rank | deviance | wheather | threshold | memory length | response mode | dose dependency | type of G | peak or start time of G | open length of G |
|---|---|---|---|---|---|---|---|---|---|
| 1 | 49.00 | atmosphere | 1015 | 10 | < th | dose independent | sin | 14 | NA |
| 6 | 49.00 | atmosphere | 1015 | 10 | < th | dose independent | sin | 2 | NA |
| 23 | 49.03 | atmosphere | 1015 | 10 | > th | dose independent | sin | 7 | NA |
| 119 | 49.03 | atmosphere | 1015 | 10 | > th | dose independent | no | NA | NA |
| 126 | 49.03 | atmosphere | 1015 | 10 | < th | dose independent | no | NA | NA |
| 130 | 49.03 | atmosphere | 1015 | 270 | > th | dose independent | rect. | 20 | 1 |
| 137 | 49.03 | atmosphere | 1015 | 10 | > th | dose independent | rect. | 23 | 1 |