Os04g0509000
blastp(Os)/ blastp(At)/ coex/// RAP/ RiceXPro/ SALAD/ ATTED-II
Description : Similar to Pto kinase interactor 1.

FiT-DB / Search/ Help/ Sample detail
|
Os04g0509000 |
blastp(Os)/ blastp(At)/ coex/// RAP/ RiceXPro/ SALAD/ ATTED-II |
|
Description : Similar to Pto kinase interactor 1.
|
|
log2(Expression) ~ Norm(μ, σ2)
μ = α + β1D + β2C + β3E + β4D*C + β5D*E + γ1N8
|
_____ |
|

 __
__
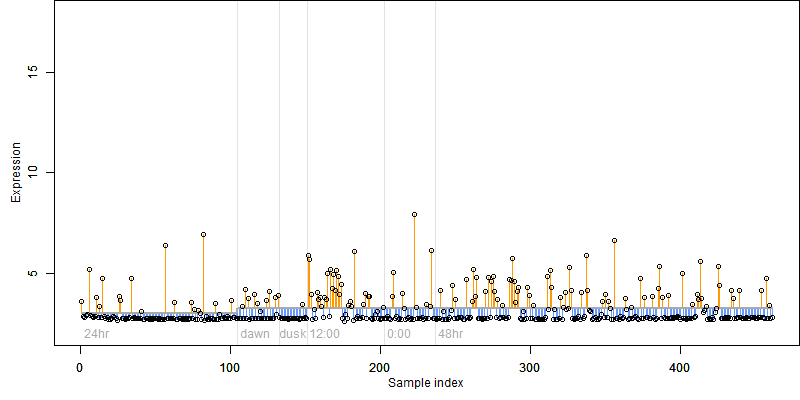
Dependence on each variable

Residual plot

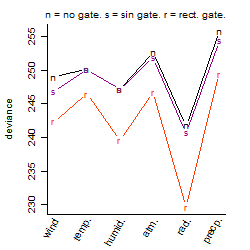
Process of the parameter reduction
(fixed parameters. wheather = radiation,
response mode = > th, dose dependency = dose independent, type of G = no)
| deviance | σ | α | β1 | β2 | β3 | β4 | β5 | γ1 | peak time of C | threshold | memory length | peak or start time of G | open length of G |
|---|---|---|---|---|---|---|---|---|---|---|---|---|---|
| 238.19 | 0.725 | 3.17 | -0.134 | 0.973 | -0.915 | -2.25 | 2.4 | -0.135 | 13.4 | 16.51 | 379 | -- | -- |
| 245.78 | 0.73 | 3.16 | -0.295 | 0.84 | -0.8 | -1.24 | -- | -0.153 | 12.9 | 19.7 | 371 | -- | -- |
| 250.6 | 0.737 | 3.17 | -0.0541 | 0.784 | -0.933 | -- | 2.06 | -0.136 | 13.4 | 20.17 | 474 | -- | -- |
| 248.75 | 0.735 | 3.18 | -0.182 | 0.923 | -0.954 | -- | -- | -0.154 | 13.6 | 20.21 | 396 | -- | -- |
| 260.62 | 0.752 | 3.19 | -0.105 | -- | -0.76 | -- | 2 | -0.138 | -- | 3.103 | 1189 | -- | -- |
| 258.6 | 0.754 | 3.21 | -0.305 | 0.523 | -- | -1.07 | -- | -0.283 | 10.9 | -- | -- | -- | -- |
| 263.38 | 0.76 | 3.21 | -0.349 | 0.529 | -- | -- | -- | -0.286 | 10.8 | -- | -- | -- | -- |
| 267.27 | 0.761 | 3.21 | -0.314 | -- | -0.73 | -- | -- | -0.21 | -- | 3.104 | 1139 | -- | -- |
| 249.76 | 0.736 | 3.18 | -- | 0.916 | -1.01 | -- | -- | -0.129 | 13.6 | 20.17 | 397 | -- | -- |
| 280.69 | 0.783 | 3.22 | -0.36 | -- | -- | -- | -- | -0.29 | -- | -- | -- | -- | -- |
| 266.59 | 0.764 | 3.2 | -- | 0.531 | -- | -- | -- | -0.247 | 10.9 | -- | -- | -- | -- |
| 269.84 | 0.765 | 3.2 | -- | -- | -0.753 | -- | -- | -0.178 | -- | 3.07 | 1139 | -- | -- |
| 284.11 | 0.787 | 3.22 | -- | -- | -- | -- | -- | -0.25 | -- | -- | -- | -- | -- |
Results of the grid search
Summarized heatmap of deviance
|
Histogram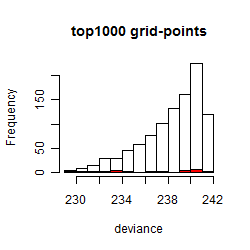 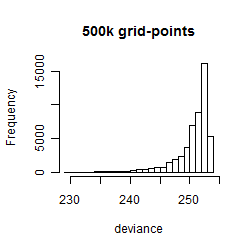
|
Local optima within top1000 grid-points
| rank | deviance | wheather | threshold | memory length | response mode | dose dependency | type of G | peak or start time of G | open length of G |
|---|---|---|---|---|---|---|---|---|---|
| 1 | 229.61 | radiation | 20 | 270 | < th | dose dependent | rect. | 8 | 5 |
| 2 | 229.72 | radiation | 20 | 270 | < th | dose dependent | rect. | 7 | 7 |
| 9 | 230.89 | radiation | 20 | 270 | < th | dose independent | rect. | 7 | 7 |
| 12 | 231.09 | radiation | 20 | 270 | < th | dose independent | rect. | 8 | 5 |
| 16 | 231.51 | radiation | 20 | 270 | < th | dose independent | rect. | 8 | 17 |
| 31 | 232.45 | radiation | 20 | 270 | < th | dose independent | rect. | 19 | 18 |
| 34 | 232.51 | radiation | 20 | 270 | < th | dose dependent | rect. | 5 | 22 |
| 56 | 233.25 | radiation | 30 | 270 | < th | dose dependent | rect. | 8 | 17 |
| 60 | 233.41 | radiation | 20 | 270 | < th | dose dependent | rect. | 7 | 19 |
| 67 | 233.66 | radiation | 20 | 270 | < th | dose independent | rect. | 6 | 21 |
| 83 | 234.07 | radiation | 30 | 270 | < th | dose dependent | rect. | 19 | 18 |
| 206 | 236.30 | radiation | 30 | 720 | < th | dose dependent | rect. | 22 | 14 |
| 314 | 237.52 | radiation | 20 | 720 | < th | dose independent | rect. | 22 | 13 |
| 561 | 239.52 | humidity | 70 | 90 | > th | dose independent | rect. | 9 | 18 |
| 583 | 239.65 | radiation | 20 | 270 | > th | dose independent | rect. | 12 | 23 |
| 623 | 239.84 | radiation | 20 | 720 | > th | dose independent | rect. | 8 | 3 |
| 675 | 240.11 | radiation | 1 | 270 | > th | dose dependent | rect. | 12 | 23 |
| 679 | 240.15 | radiation | 20 | 10 | < th | dose independent | rect. | 11 | 1 |
| 713 | 240.30 | radiation | 20 | 720 | > th | dose independent | rect. | 6 | 5 |
| 758 | 240.45 | radiation | 1 | 720 | > th | dose dependent | rect. | 6 | 5 |
| 814 | 240.75 | radiation | 30 | 720 | < th | dose dependent | sin | 8 | NA |
| 910 | 241.14 | radiation | 20 | 720 | > th | dose independent | sin | 9 | NA |
| 913 | 241.14 | humidity | 50 | 30 | > th | dose dependent | rect. | 11 | 16 |