Os04g0494900
blastp(Os)/ blastp(At)/ coex/// RAP/ RiceXPro/ SALAD/ ATTED-II
Description : Similar to Unidentified precursor.

FiT-DB / Search/ Help/ Sample detail
|
Os04g0494900 |
blastp(Os)/ blastp(At)/ coex/// RAP/ RiceXPro/ SALAD/ ATTED-II |
|
Description : Similar to Unidentified precursor.
|
|
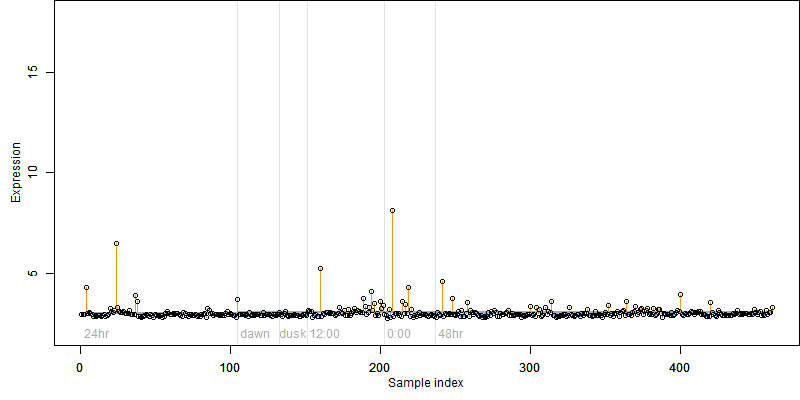
log2(Expression) ~ Norm(μ, σ2)
μ = α + β1D + β2C + β3E + β4D*C + β5D*E + γ1N8
|
_____ |
|
 __
__
Dependence on each variable

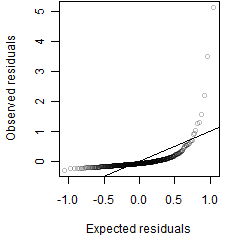
Residual plot

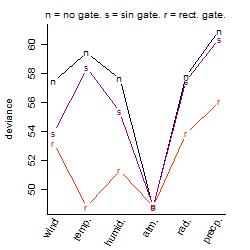
Process of the parameter reduction
(fixed parameters. wheather = atmosphere,
response mode = > th, dose dependency = dose dependent, type of G = no)
| deviance | σ | α | β1 | β2 | β3 | β4 | β5 | γ1 | peak time of C | threshold | memory length | peak or start time of G | open length of G |
|---|---|---|---|---|---|---|---|---|---|---|---|---|---|
| 47.74 | 0.325 | 3.01 | -0.00117 | 0.14 | 1.33 | 0.157 | -3.48 | 0.00844 | 11.2 | 1013 | 12 | -- | -- |
| 53.83 | 0.344 | 3.01 | -0.0497 | 0.143 | 1.29 | 0.382 | -- | -0.000904 | 11.3 | 1012 | 21 | -- | -- |
| 47.84 | 0.322 | 3.01 | 0.00526 | 0.141 | 1.33 | -- | -3.56 | 0.00844 | 11.3 | 1013 | 12 | -- | -- |
| 54.45 | 0.346 | 3.01 | -0.0346 | 0.141 | 1.27 | -- | -- | 0.000171 | 11.3 | 1012 | 21 | -- | -- |
| 49.03 | 0.326 | 3.01 | 0.00433 | -- | 1.26 | -- | -3.55 | 0.00761 | -- | 1013 | 16 | -- | -- |
| 61.02 | 0.366 | 3.02 | -0.0723 | 0.113 | -- | 0.311 | -- | -0.0225 | 11.1 | -- | -- | -- | -- |
| 61.43 | 0.367 | 3.02 | -0.0596 | 0.112 | -- | -- | -- | -0.0214 | 11.1 | -- | -- | -- | -- |
| 55.5 | 0.349 | 3.01 | -0.0255 | -- | 1.14 | -- | -- | 0.00725 | -- | 1011 | 17 | -- | -- |
| 54.48 | 0.346 | 3.01 | -- | 0.141 | 1.27 | -- | -- | 0.00413 | 11.3 | 1012 | 21 | -- | -- |
| 62.21 | 0.369 | 3.02 | -0.0623 | -- | -- | -- | -- | -0.0224 | -- | -- | -- | -- | -- |
| 61.52 | 0.367 | 3.01 | -- | 0.112 | -- | -- | -- | -0.0148 | 11.2 | -- | -- | -- | -- |
| 55.52 | 0.348 | 3.01 | -- | -- | 1.14 | -- | -- | 0.0102 | -- | 1011 | 21 | -- | -- |
| 62.31 | 0.368 | 3.02 | -- | -- | -- | -- | -- | -0.0155 | -- | -- | -- | -- | -- |
Results of the grid search
Summarized heatmap of deviance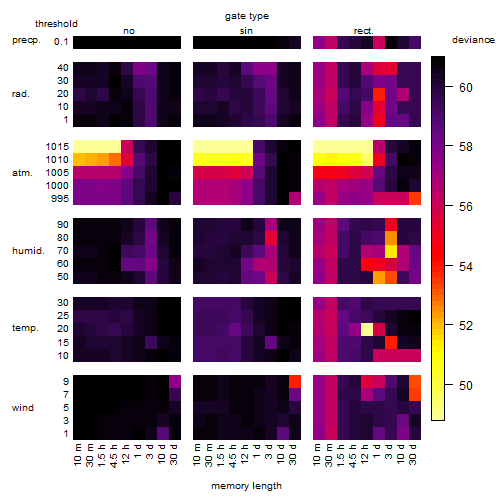
|
Histogram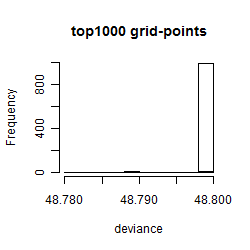 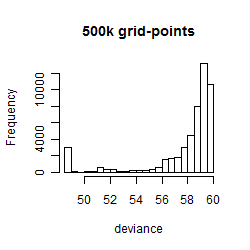
|
Local optima within top1000 grid-points
| rank | deviance | wheather | threshold | memory length | response mode | dose dependency | type of G | peak or start time of G | open length of G |
|---|---|---|---|---|---|---|---|---|---|
| 1 | 48.78 | temperature | 20 | 720 | < th | dose independent | rect. | 17 | 1 |
| 2 | 48.79 | atmosphere | 1015 | 10 | < th | dose independent | sin | 13 | NA |
| 6 | 48.79 | atmosphere | 1015 | 10 | < th | dose independent | sin | 1 | NA |
| 10 | 48.80 | atmosphere | 1015 | 10 | > th | dose independent | sin | 7 | NA |
| 106 | 48.80 | atmosphere | 1015 | 10 | > th | dose independent | no | NA | NA |
| 112 | 48.80 | atmosphere | 1015 | 10 | < th | dose independent | no | NA | NA |
| 116 | 48.80 | atmosphere | 1015 | 270 | > th | dose independent | rect. | 20 | 1 |
| 123 | 48.80 | atmosphere | 1015 | 10 | > th | dose independent | rect. | 23 | 1 |