Os04g0466000
blastp(Os)/ blastp(At)/ coex/// RAP/ RiceXPro/ SALAD/ ATTED-II
Description : Conserved hypothetical protein.
FiT-DB / Search/ Help/ Sample detail
|
Os04g0466000 |
blastp(Os)/ blastp(At)/ coex/// RAP/ RiceXPro/ SALAD/ ATTED-II |
|
Description : Conserved hypothetical protein.
|
|
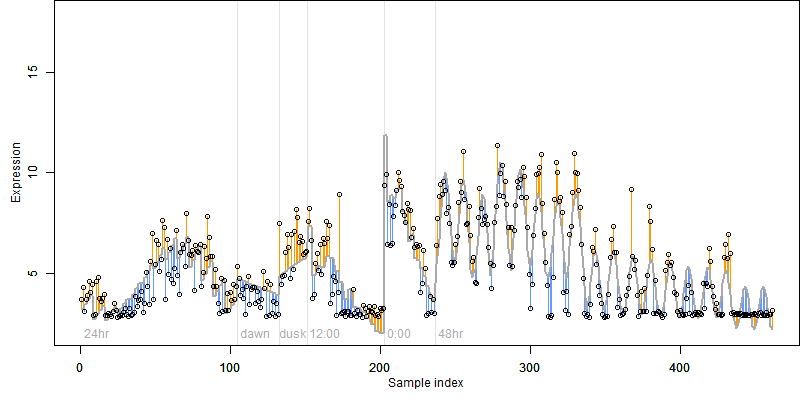
log2(Expression) ~ Norm(μ, σ2)
μ = α + β1D + β2C + β3E + β4D*C + β5D*E + γ1N8
|
_____ |
|
 __
__
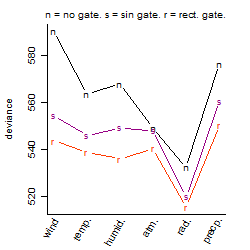
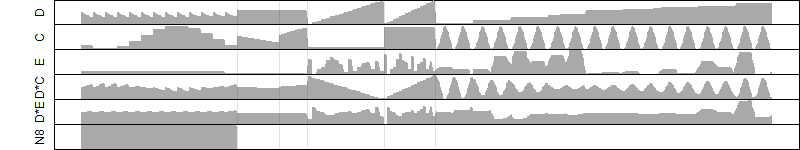
Dependence on each variable

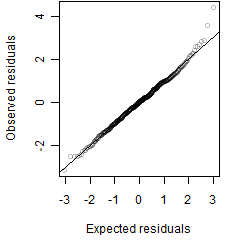
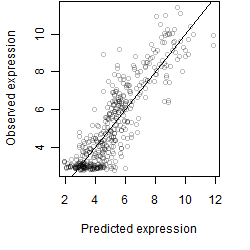
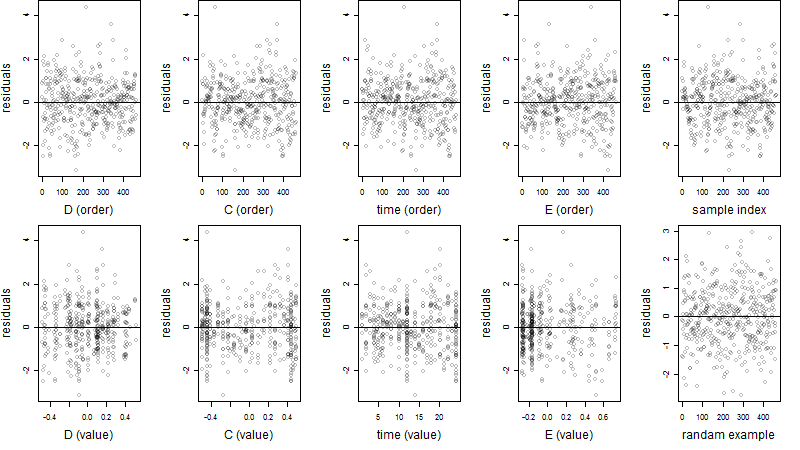
Residual plot
Process of the parameter reduction
(fixed parameters. wheather = radiation,
response mode = < th, dose dependency = dose independent, type of G = rect.)
| deviance | σ | α | β1 | β2 | β3 | β4 | β5 | γ1 | peak time of C | threshold | memory length | peak or start time of G | open length of G |
|---|---|---|---|---|---|---|---|---|---|---|---|---|---|
| 507.22 | 1.06 | 5.42 | -5.27 | 3.14 | 1.59 | -2.48 | -4.01 | -0.966 | 22.3 | 15.67 | 1347 | 7.62 | 5.67 |
| 536.1 | 1.08 | 5.43 | -5.33 | 3.21 | 1.74 | -2.51 | -- | -0.953 | 22.2 | 14.04 | 1371 | 7.33 | 6.23 |
| 525.91 | 1.07 | 5.43 | -5 | 3.04 | 1.58 | -- | -4.74 | -0.98 | 22.3 | 16.68 | 1189 | 8.25 | 6.39 |
| 564.35 | 1.11 | 5.44 | -5.29 | 3.2 | 1.71 | -- | -- | -0.956 | 22.2 | 13.11 | 1355 | 7.33 | 6.16 |
| 625.28 | 1.16 | 5.54 | -6.24 | -- | 3.45 | -- | -5.08 | -1.61 | -- | 54.69 | 991 | 9.83 | 8.02 |
| 616.83 | 1.16 | 5.58 | -5.93 | 3.24 | -- | -2.95 | -- | -1.5 | 22.2 | -- | -- | -- | -- |
| 651.54 | 1.2 | 5.58 | -5.81 | 3.25 | -- | -- | -- | -1.49 | 22.2 | -- | -- | -- | -- |
| 654.08 | 1.19 | 5.49 | -5.84 | -- | 2.31 | -- | -- | -1.53 | -- | 79.91 | 673 | 15 | 3.52 |
| 1241.62 | 1.64 | 5.44 | -- | 2.81 | 2.77 | -- | -- | -0.668 | 22.2 | 10.31 | 1371 | 7.95 | 5.62 |
| 1293.16 | 1.68 | 5.49 | -5.77 | -- | -- | -- | -- | -1.49 | -- | -- | -- | -- | -- |
| 1542.37 | 1.84 | 5.43 | -- | 3.23 | -- | -- | -- | -0.845 | 22.1 | -- | -- | -- | -- |
| 1525.68 | 1.82 | 5.34 | -- | -- | 2.65 | -- | -- | -0.801 | -- | 110.7 | 651 | 14.9 | 3.67 |
| 2170.58 | 2.17 | 5.35 | -- | -- | -- | -- | -- | -0.846 | -- | -- | -- | -- | -- |
Results of the grid search
Summarized heatmap of deviance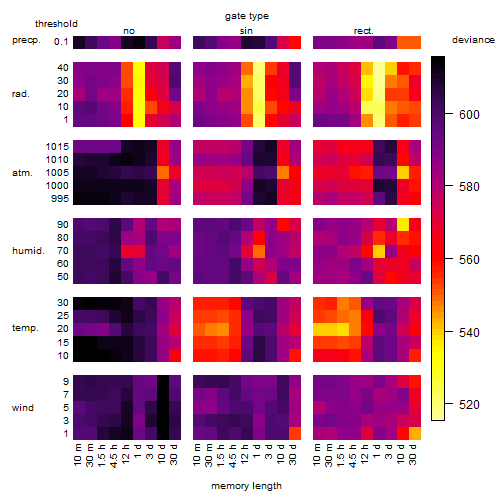
|
Histogram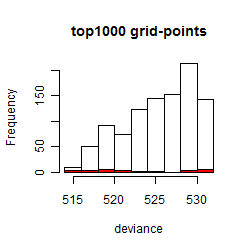 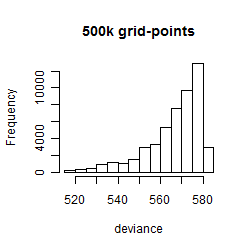
|
Local optima within top1000 grid-points
| rank | deviance | wheather | threshold | memory length | response mode | dose dependency | type of G | peak or start time of G | open length of G |
|---|---|---|---|---|---|---|---|---|---|
| 1 | 515.35 | radiation | 40 | 1440 | < th | dose dependent | rect. | 6 | 8 |
| 2 | 515.50 | radiation | 40 | 1440 | < th | dose dependent | rect. | 7 | 6 |
| 8 | 515.97 | radiation | 40 | 1440 | < th | dose dependent | rect. | 2 | 12 |
| 13 | 516.16 | radiation | 40 | 1440 | < th | dose dependent | rect. | 19 | 19 |
| 15 | 516.18 | radiation | 40 | 1440 | < th | dose dependent | rect. | 22 | 16 |
| 52 | 517.70 | radiation | 20 | 1440 | < th | dose independent | rect. | 7 | 6 |
| 62 | 518.22 | radiation | 20 | 1440 | < th | dose independent | rect. | 2 | 11 |
| 66 | 518.25 | radiation | 20 | 1440 | < th | dose independent | rect. | 18 | 19 |
| 73 | 518.42 | radiation | 20 | 1440 | < th | dose independent | rect. | 22 | 15 |
| 79 | 518.82 | radiation | 1 | 1440 | > th | dose dependent | rect. | 6 | 8 |
| 146 | 519.83 | radiation | 40 | 1440 | < th | dose dependent | sin | 6 | NA |
| 198 | 521.19 | radiation | 1 | 1440 | > th | dose dependent | sin | 7 | NA |
| 208 | 521.52 | radiation | 20 | 1440 | < th | dose independent | sin | 6 | NA |
| 209 | 521.55 | radiation | 20 | 1440 | > th | dose independent | rect. | 8 | 5 |
| 248 | 522.52 | radiation | 10 | 720 | < th | dose independent | rect. | 13 | 5 |
| 265 | 522.67 | radiation | 20 | 1440 | < th | dose independent | rect. | 8 | 2 |
| 448 | 525.16 | radiation | 10 | 1440 | > th | dose independent | sin | 7 | NA |
| 466 | 525.57 | radiation | 10 | 720 | < th | dose independent | rect. | 10 | 8 |
| 832 | 529.88 | radiation | 30 | 1440 | < th | dose independent | rect. | 11 | 2 |
| 855 | 529.95 | radiation | 40 | 1440 | < th | dose dependent | rect. | 11 | 2 |
| 857 | 529.98 | radiation | 10 | 1440 | < th | dose independent | rect. | 6 | 15 |
| 860 | 530.02 | radiation | 10 | 1440 | < th | dose independent | rect. | 6 | 17 |
| 866 | 530.08 | radiation | 10 | 1440 | < th | dose independent | rect. | 6 | 22 |
| 892 | 530.42 | radiation | 30 | 1440 | > th | dose independent | rect. | 11 | 2 |
| 895 | 530.46 | radiation | 10 | 1440 | > th | dose dependent | rect. | 11 | 2 |
| 938 | 531.15 | radiation | 10 | 720 | < th | dose independent | rect. | 16 | 1 |
| 973 | 531.41 | radiation | 10 | 1440 | < th | dose independent | rect. | 12 | 23 |