Os04g0434800
blastp(Os)/ blastp(At)/ coex/// RAP/ RiceXPro/ SALAD/ ATTED-II
Description : Similar to Thylakoid-bound ascorbate peroxidase (EC 1.11.1.11) (Fragment).


FiT-DB / Search/ Help/ Sample detail
|
Os04g0434800 |
blastp(Os)/ blastp(At)/ coex/// RAP/ RiceXPro/ SALAD/ ATTED-II |
|
Description : Similar to Thylakoid-bound ascorbate peroxidase (EC 1.11.1.11) (Fragment).
|
|
log2(Expression) ~ Norm(μ, σ2)
μ = α + β1D + β2C + β3E + β4D*C + β5D*E + γ1N8
|
_____ |
|

 __
__
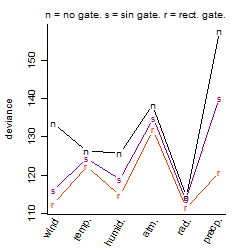
Dependence on each variable

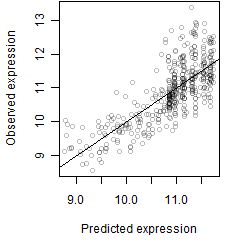
Residual plot

Process of the parameter reduction
(fixed parameters. wheather = temperature,
response mode = > th, dose dependency = dose independent, type of G = no)
| deviance | σ | α | β1 | β2 | β3 | β4 | β5 | γ1 | peak time of C | threshold | memory length | peak or start time of G | open length of G |
|---|---|---|---|---|---|---|---|---|---|---|---|---|---|
| 124.15 | 0.524 | 11 | -0.0707 | 0.8 | 1.31 | 1.76 | -6.8 | 0.122 | 17 | 25.95 | 4630 | -- | -- |
| 132.78 | 0.537 | 10.8 | 0.919 | 0.824 | 1.6 | 1.8 | -- | 0.258 | 17.2 | 20.32 | 9198 | -- | -- |
| 131.91 | 0.535 | 11 | -0.0386 | 0.817 | 1.33 | -- | -6.8 | 0.135 | 17 | 25.99 | 4573 | -- | -- |
| 140.1 | 0.551 | 10.8 | 0.927 | 0.856 | 1.57 | -- | -- | 0.265 | 17 | 20.34 | 9622 | -- | -- |
| 164.73 | 0.598 | 11 | -0.0407 | -- | 1.36 | -- | -6.67 | 0.179 | -- | 26.61 | 4773 | -- | -- |
| 173.63 | 0.618 | 10.7 | 2.13 | 0.818 | -- | 1.73 | -- | 0.78 | 17.1 | -- | -- | -- | -- |
| 181.21 | 0.63 | 10.7 | 2.13 | 0.83 | -- | -- | -- | 0.788 | 17.2 | -- | -- | -- | -- |
| 174.24 | 0.617 | 10.8 | 1.92 | -- | 0.673 | -- | -- | 0.572 | -- | 26.61 | 4773 | -- | -- |
| 146.84 | 0.564 | 10.9 | -- | 0.835 | 2.11 | -- | -- | 0.0554 | 17 | 19.7 | 15601 | -- | -- |
| 217.2 | 0.689 | 10.7 | 2.1 | -- | -- | -- | -- | 0.767 | -- | -- | -- | -- | -- |
| 300.31 | 0.811 | 10.8 | -- | 0.793 | -- | -- | -- | 0.551 | 17.3 | -- | -- | -- | -- |
| 184.06 | 0.632 | 10.9 | -- | -- | 2.07 | -- | -- | 0.0441 | -- | 19.76 | 16272 | -- | -- |
| 333.16 | 0.852 | 10.8 | -- | -- | -- | -- | -- | 0.534 | -- | -- | -- | -- | -- |
Results of the grid search
Summarized heatmap of deviance
|
Histogram 
|
Local optima within top1000 grid-points
| rank | deviance | wheather | threshold | memory length | response mode | dose dependency | type of G | peak or start time of G | open length of G |
|---|---|---|---|---|---|---|---|---|---|
| 1 | 111.65 | radiation | 10 | 43200 | < th | dose independent | rect. | 8 | 1 |
| 5 | 112.42 | radiation | 20 | 43200 | < th | dose dependent | rect. | 7 | 2 |
| 6 | 112.45 | wind | 1 | 43200 | < th | dose dependent | rect. | 22 | 4 |
| 17 | 112.97 | radiation | 20 | 43200 | < th | dose dependent | rect. | 24 | 9 |
| 40 | 113.37 | radiation | 20 | 43200 | < th | dose independent | rect. | 1 | 10 |
| 112 | 113.67 | radiation | 20 | 43200 | < th | dose independent | sin | 6 | NA |
| 132 | 113.83 | radiation | 20 | 43200 | < th | dose independent | rect. | 7 | 9 |
| 175 | 113.93 | radiation | 20 | 43200 | < th | dose independent | rect. | 4 | 12 |
| 199 | 114.01 | radiation | 1 | 43200 | > th | dose dependent | rect. | 6 | 4 |
| 216 | 114.06 | radiation | 20 | 43200 | > th | dose independent | rect. | 8 | 1 |
| 217 | 114.06 | radiation | 1 | 43200 | > th | dose dependent | rect. | 7 | 2 |
| 223 | 114.09 | radiation | 20 | 43200 | < th | dose independent | rect. | 13 | 23 |
| 231 | 114.10 | radiation | 20 | 43200 | > th | dose independent | rect. | 17 | 17 |
| 240 | 114.11 | radiation | 20 | 43200 | > th | dose independent | rect. | 6 | 4 |
| 280 | 114.15 | radiation | 30 | 43200 | < th | dose independent | rect. | 9 | 20 |
| 362 | 114.19 | radiation | 30 | 43200 | < th | dose dependent | sin | 9 | NA |
| 373 | 114.24 | radiation | 20 | 43200 | < th | dose independent | no | NA | NA |
| 607 | 114.53 | radiation | 1 | 43200 | > th | dose dependent | sin | 9 | NA |
| 803 | 114.66 | radiation | 30 | 43200 | > th | dose independent | rect. | 10 | 2 |
| 852 | 114.78 | humidity | 80 | 43200 | < th | dose dependent | rect. | 20 | 14 |
| 870 | 114.80 | wind | 1 | 43200 | < th | dose dependent | rect. | 13 | 15 |
| 871 | 114.81 | radiation | 20 | 43200 | > th | dose independent | sin | 11 | NA |
| 941 | 114.89 | radiation | 20 | 43200 | > th | dose dependent | rect. | 9 | 6 |