Os04g0316800
blastp(Os)/ blastp(At)/ coex/// RAP/ RiceXPro/ SALAD/ ATTED-II
Description : Protein of unknown function DUF295 family protein.


FiT-DB / Search/ Help/ Sample detail
|
Os04g0316800 |
blastp(Os)/ blastp(At)/ coex/// RAP/ RiceXPro/ SALAD/ ATTED-II |
|
Description : Protein of unknown function DUF295 family protein.
|
|
log2(Expression) ~ Norm(μ, σ2)
μ = α + β1D + β2C + β3E + β4D*C + β5D*E + γ1N8
|
_____ |
|

 __
__
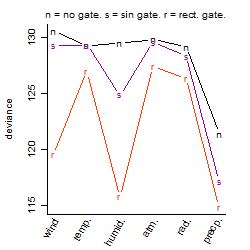
Dependence on each variable

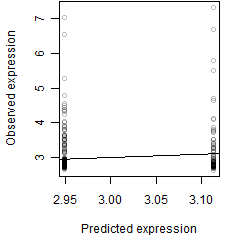
Residual plot

Process of the parameter reduction
(fixed parameters. wheather = precipitation,
response mode = > th, dose dependency = dose dependent, type of G = no)
| deviance | σ | α | β1 | β2 | β3 | β4 | β5 | γ1 | peak time of C | threshold | memory length | peak or start time of G | open length of G |
|---|---|---|---|---|---|---|---|---|---|---|---|---|---|
| 114.85 | 0.499 | 2.94 | -0.151 | 0.109 | -2.46 | -0.497 | 23.8 | 0.156 | 16.1 | 1.621 | 37 | -- | -- |
| 124.49 | 0.52 | 2.96 | -0.248 | 0.111 | 1.96 | -0.374 | -- | 0.155 | 18.1 | 2.001 | 109 | -- | -- |
| 115.55 | 0.501 | 2.94 | -0.154 | 0.107 | -2.53 | -- | 23.9 | 0.155 | 15.3 | 1.617 | 38 | -- | -- |
| 124.66 | 0.52 | 2.95 | -0.21 | 0.0972 | 2.03 | -- | -- | 0.154 | 16.7 | 2.5 | 81 | -- | -- |
| 116.19 | 0.502 | 2.94 | -0.157 | -- | -2.76 | -- | 24.8 | 0.152 | -- | 1.624 | 39 | -- | -- |
| 131.99 | 0.539 | 2.95 | -0.16 | 0.129 | -- | -0.402 | -- | 0.15 | 15.9 | -- | -- | -- | -- |
| 132.44 | 0.539 | 2.95 | -0.166 | 0.129 | -- | -- | -- | 0.148 | 16.4 | -- | -- | -- | -- |
| 116.19 | 0.502 | 2.95 | -0.211 | -- | 4.15 | -- | -- | 0.152 | -- | 2.008 | 49 | -- | -- |
| 117.31 | 0.504 | 2.95 | -- | 0.0915 | 3.68 | -- | -- | 0.162 | 18.6 | 1.936 | 36 | -- | -- |
| 133.33 | 0.54 | 2.95 | -0.171 | -- | -- | -- | -- | 0.145 | -- | -- | -- | -- | -- |
| 133.17 | 0.54 | 2.95 | -- | 0.132 | -- | -- | -- | 0.167 | 16.4 | -- | -- | -- | -- |
| 117.36 | 0.505 | 2.95 | -- | -- | 4.1 | -- | -- | 0.175 | -- | 2.02 | 40 | -- | -- |
| 134.1 | 0.541 | 2.95 | -- | -- | -- | -- | -- | 0.164 | -- | -- | -- | -- | -- |
Results of the grid search
Summarized heatmap of deviance
|
Histogram 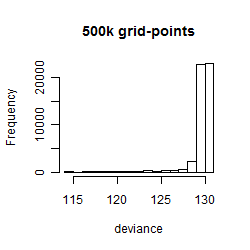
|
Local optima within top1000 grid-points
| rank | deviance | wheather | threshold | memory length | response mode | dose dependency | type of G | peak or start time of G | open length of G |
|---|---|---|---|---|---|---|---|---|---|
| 1 | 114.85 | precipitation | 0.1 | 10 | > th | dose independent | rect. | 19 | 1 |
| 29 | 114.85 | precipitation | 0.1 | 10 | > th | dose dependent | rect. | 19 | 1 |
| 91 | 115.73 | precipitation | 0.1 | 90 | > th | dose dependent | rect. | 14 | 6 |
| 93 | 115.79 | humidity | 90.0 | 90 | > th | dose dependent | rect. | 18 | 1 |
| 185 | 117.17 | precipitation | 0.1 | 30 | > th | dose dependent | sin | 18 | NA |
| 234 | 117.58 | precipitation | 0.1 | 90 | > th | dose independent | rect. | 15 | 5 |
| 255 | 117.88 | precipitation | 0.1 | 90 | > th | dose dependent | rect. | 18 | 17 |
| 379 | 119.54 | wind | 7.0 | 10 | > th | dose dependent | rect. | 12 | 1 |
| 523 | 120.43 | precipitation | 0.1 | 30 | < th | dose independent | sin | 18 | NA |
| 527 | 120.43 | precipitation | 0.1 | 30 | < th | dose dependent | sin | 18 | NA |
| 536 | 120.50 | precipitation | 0.1 | 30 | > th | dose independent | sin | 17 | NA |
| 702 | 121.36 | precipitation | 0.1 | 90 | > th | dose dependent | no | NA | NA |
| 953 | 122.86 | wind | 7.0 | 10 | > th | dose independent | rect. | 12 | 1 |
| 961 | 123.00 | humidity | 90.0 | 270 | > th | dose independent | rect. | 16 | 1 |
| 962 | 123.00 | humidity | 90.0 | 270 | > th | dose dependent | rect. | 16 | 1 |
| 970 | 123.07 | wind | 1.0 | 270 | < th | dose dependent | rect. | 18 | 2 |
| 979 | 123.11 | wind | 1.0 | 270 | < th | dose independent | rect. | 18 | 2 |