Os03g0380600
blastp(Os)/ blastp(At)/ coex/// RAP/ RiceXPro/ SALAD/ ATTED-II
Description : Conserved hypothetical protein.

FiT-DB / Search/ Help/ Sample detail
|
Os03g0380600 |
blastp(Os)/ blastp(At)/ coex/// RAP/ RiceXPro/ SALAD/ ATTED-II |
|
Description : Conserved hypothetical protein.
|
|
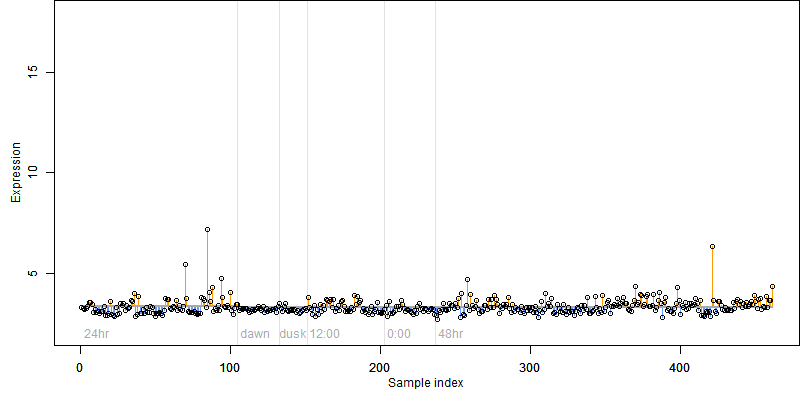
log2(Expression) ~ Norm(μ, σ2)
μ = α + β1D + β2C + β3E + β4D*C + β5D*E + γ1N8
|
_____ |
|

 __
__

Dependence on each variable

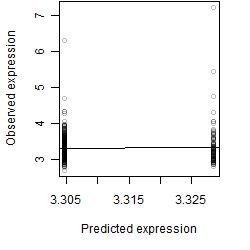
Residual plot

Process of the parameter reduction
(fixed parameters. wheather = precipitation,
response mode = > th, dose dependency = dose dependent, type of G = no)
| deviance | σ | α | β1 | β2 | β3 | β4 | β5 | γ1 | peak time of C | threshold | memory length | peak or start time of G | open length of G |
|---|---|---|---|---|---|---|---|---|---|---|---|---|---|
| 58.03 | 0.355 | 3.3 | 0.0497 | 0.17 | 2.56 | -0.138 | 1.34 | 0.0334 | 6.5 | 0.5 | 12 | -- | -- |
| 58.03 | 0.358 | 3.3 | 0.0466 | 0.17 | 2.95 | -0.138 | -- | 0.0334 | 6.5 | 0.5 | 12 | -- | -- |
| 58.07 | 0.355 | 3.3 | 0.0492 | 0.17 | 2.42 | -- | 1.81 | 0.0341 | 6.79 | 0.8058 | 10 | -- | -- |
| 58.07 | 0.357 | 3.3 | 0.0452 | 0.17 | 2.94 | -- | -- | 0.034 | 6.79 | 0.9998 | 11 | -- | -- |
| 59.57 | 0.359 | 3.3 | 0.0528 | -- | 2.43 | -- | 1.98 | 0.0374 | -- | 0.7898 | 10 | -- | -- |
| 66.61 | 0.383 | 3.3 | 0.0736 | 0.191 | -- | -0.0158 | -- | 0.0283 | 6.44 | -- | -- | -- | -- |
| 66.62 | 0.382 | 3.3 | 0.0734 | 0.191 | -- | -- | -- | 0.0284 | 6.45 | -- | -- | -- | -- |
| 59.57 | 0.361 | 3.3 | 0.0484 | -- | 3 | -- | -- | 0.0374 | -- | 0.7561 | 10 | -- | -- |
| 58.12 | 0.357 | 3.3 | -- | 0.17 | 2.95 | -- | -- | 0.029 | 6.77 | 0.9904 | 11 | -- | -- |
| 68.5 | 0.387 | 3.3 | 0.0782 | -- | -- | -- | -- | 0.0324 | -- | -- | -- | -- | -- |
| 66.76 | 0.382 | 3.3 | -- | 0.192 | -- | -- | -- | 0.0202 | 6.43 | -- | -- | -- | -- |
| 59.63 | 0.361 | 3.3 | -- | -- | 3.01 | -- | -- | 0.0321 | -- | 0.7561 | 10 | -- | -- |
| 68.66 | 0.387 | 3.3 | -- | -- | -- | -- | -- | 0.0237 | -- | -- | -- | -- | -- |
Results of the grid search
Summarized heatmap of deviance
|
Histogram 
|
Local optima within top1000 grid-points
| rank | deviance | wheather | threshold | memory length | response mode | dose dependency | type of G | peak or start time of G | open length of G |
|---|---|---|---|---|---|---|---|---|---|
| 1 | 54.63 | precipitation | 0.1 | 10 | < th | dose independent | rect. | 3 | 23 |
| 2 | 54.63 | precipitation | 0.1 | 10 | < th | dose dependent | rect. | 3 | 23 |
| 3 | 57.89 | wind | 3.0 | 10 | > th | dose independent | rect. | 4 | 1 |
| 5 | 57.89 | wind | 3.0 | 10 | > th | dose dependent | rect. | 4 | 1 |
| 7 | 57.95 | precipitation | 0.1 | 90 | > th | dose dependent | rect. | 3 | 3 |
| 12 | 57.99 | precipitation | 0.1 | 90 | > th | dose dependent | rect. | 3 | 1 |
| 20 | 58.01 | precipitation | 0.1 | 90 | > th | dose independent | rect. | 3 | 3 |
| 25 | 58.02 | precipitation | 0.1 | 90 | > th | dose independent | rect. | 4 | 1 |
| 26 | 58.02 | precipitation | 0.1 | 10 | > th | dose independent | rect. | 4 | 2 |
| 67 | 58.05 | precipitation | 0.1 | 10 | < th | dose independent | sin | 6 | NA |
| 69 | 58.05 | precipitation | 0.1 | 10 | < th | dose dependent | sin | 6 | NA |
| 132 | 58.16 | atmosphere | 1000.0 | 30 | > th | dose independent | rect. | 3 | 23 |
| 187 | 58.19 | precipitation | 0.1 | 10 | > th | dose dependent | sin | 6 | NA |
| 346 | 58.35 | precipitation | 0.1 | 10 | > th | dose independent | sin | 5 | NA |
| 450 | 58.47 | wind | 5.0 | 90 | > th | dose independent | rect. | 3 | 4 |
| 565 | 58.73 | wind | 5.0 | 90 | > th | dose dependent | rect. | 3 | 4 |
| 638 | 58.86 | atmosphere | 1005.0 | 10 | > th | dose dependent | rect. | 2 | 2 |
| 688 | 58.98 | precipitation | 0.1 | 10 | > th | dose dependent | no | NA | NA |
| 745 | 59.04 | atmosphere | 1005.0 | 90 | > th | dose dependent | rect. | 2 | 1 |
| 825 | 59.36 | radiation | 1.0 | 43200 | < th | dose dependent | rect. | 3 | 1 |
| 934 | 59.65 | temperature | 25.0 | 90 | > th | dose dependent | rect. | 1 | 3 |
| 967 | 59.75 | radiation | 1.0 | 4320 | < th | dose dependent | rect. | 3 | 1 |
| 970 | 59.78 | temperature | 25.0 | 90 | > th | dose independent | rect. | 1 | 1 |
| 973 | 59.79 | precipitation | 0.1 | 10 | < th | dose independent | rect. | 11 | 23 |
| 974 | 59.79 | precipitation | 0.1 | 10 | < th | dose dependent | rect. | 11 | 23 |
| 978 | 59.85 | precipitation | 0.1 | 10 | > th | dose independent | no | NA | NA |
| 979 | 59.85 | precipitation | 0.1 | 10 | < th | dose independent | no | NA | NA |