Os03g0235000
blastp(Os)/ blastp(At)/ coex/// RAP/ RiceXPro/ SALAD/ ATTED-II
Description : Peroxidase (EC 1.11.1.7).

FiT-DB / Search/ Help/ Sample detail
|
Os03g0235000 |
blastp(Os)/ blastp(At)/ coex/// RAP/ RiceXPro/ SALAD/ ATTED-II |
|
Description : Peroxidase (EC 1.11.1.7).
|
|
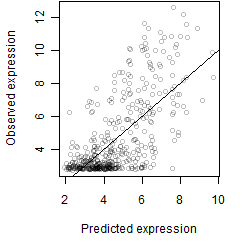
log2(Expression) ~ Norm(μ, σ2)
μ = α + β1D + β2C + β3E + β4D*C + β5D*E + γ1N8
|
_____ |
|

 __
__
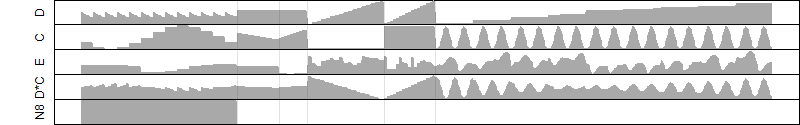
Dependence on each variable

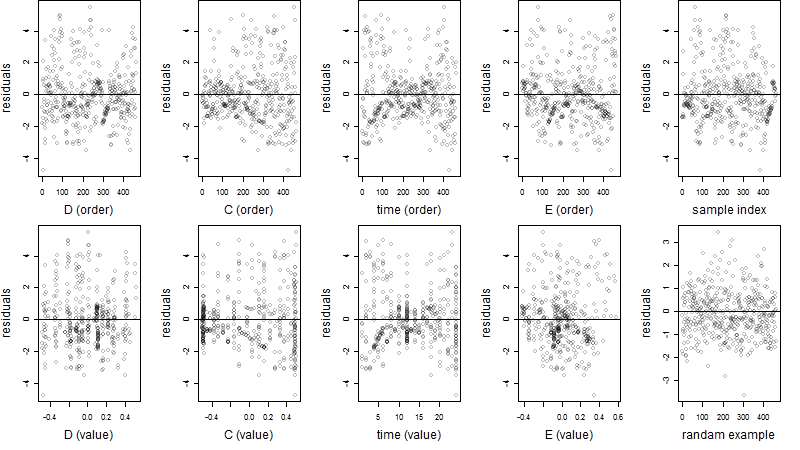
Residual plot
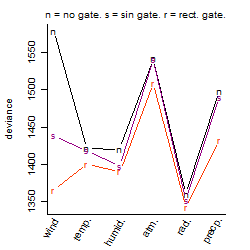
Process of the parameter reduction
(fixed parameters. wheather = radiation,
response mode = < th, dose dependency = dose dependent, type of G = sin)
| deviance | σ | α | β1 | β2 | β3 | β4 | β5 | γ1 | peak time of C | threshold | memory length | peak or start time of G | open length of G |
|---|---|---|---|---|---|---|---|---|---|---|---|---|---|
| 1320.01 | 1.71 | 4.35 | 1.01 | 3.22 | 5.33 | 2.17 | -3.14 | 1.06 | 0.0234 | 21.24 | 1312 | 13.8 | -- |
| 1325.41 | 1.7 | 4.4 | 0.646 | 3.9 | 6.06 | 2.47 | -- | 0.989 | 23.2 | 23.93 | 1305 | 11.7 | -- |
| 1333.42 | 1.7 | 4.35 | 0.958 | 3.63 | 6.29 | -- | -4.99 | 1.09 | 22.8 | 24.73 | 1257 | 12.1 | -- |
| 1350.71 | 1.71 | 4.41 | 0.546 | 3.89 | 5.87 | -- | -- | 0.968 | 23.3 | 25.04 | 1307 | 11.6 | -- |
| 1483.27 | 1.79 | 4.27 | 0.122 | -- | 6.79 | -- | -1.42 | 0.945 | -- | 15.09 | 2039 | 12.5 | -- |
| 1807.76 | 1.99 | 4.59 | 0.18 | 3.21 | -- | 0.955 | -- | -0.0908 | 1.2 | -- | -- | -- | -- |
| 1811.43 | 1.99 | 4.59 | 0.146 | 3.21 | -- | -- | -- | -0.0968 | 1.25 | -- | -- | -- | -- |
| 1462.55 | 1.78 | 4.34 | 0.147 | -- | 6.55 | -- | -- | 0.879 | -- | 16.07 | 2043 | 12.9 | -- |
| 1357.25 | 1.72 | 4.43 | -- | 3.9 | 5.8 | -- | -- | 0.858 | 23.3 | 23.23 | 1308 | 11.6 | -- |
| 2446.95 | 2.31 | 4.54 | 0.27 | -- | -- | -- | -- | -0.0312 | -- | -- | -- | -- | -- |
| 1811.99 | 1.99 | 4.59 | -- | 3.21 | -- | -- | -- | -0.113 | 1.25 | -- | -- | -- | -- |
| 1463.09 | 1.78 | 4.34 | -- | -- | 6.56 | -- | -- | 0.861 | -- | 15.75 | 2044 | 12.9 | -- |
| 2448.87 | 2.31 | 4.55 | -- | -- | -- | -- | -- | -0.0611 | -- | -- | -- | -- | -- |
Results of the grid search
Summarized heatmap of deviance
|
Histogram 
|
Local optima within top1000 grid-points
| rank | deviance | wheather | threshold | memory length | response mode | dose dependency | type of G | peak or start time of G | open length of G |
|---|---|---|---|---|---|---|---|---|---|
| 1 | 1342.81 | radiation | 20 | 1440 | > th | dose independent | rect. | 11 | 22 |
| 3 | 1346.75 | radiation | 10 | 1440 | > th | dose independent | rect. | 16 | 23 |
| 5 | 1349.85 | radiation | 20 | 1440 | < th | dose dependent | rect. | 11 | 20 |
| 6 | 1350.00 | radiation | 10 | 1440 | > th | dose independent | rect. | 8 | 23 |
| 10 | 1352.42 | radiation | 20 | 1440 | < th | dose dependent | sin | 20 | NA |
| 27 | 1358.91 | radiation | 20 | 1440 | < th | dose dependent | rect. | 8 | 16 |
| 28 | 1358.93 | radiation | 20 | 1440 | < th | dose dependent | rect. | 8 | 11 |
| 29 | 1359.02 | radiation | 20 | 1440 | < th | dose dependent | rect. | 8 | 19 |
| 45 | 1360.16 | radiation | 10 | 1440 | > th | dose independent | rect. | 6 | 12 |
| 58 | 1360.45 | radiation | 10 | 1440 | > th | dose independent | no | NA | NA |
| 125 | 1360.69 | radiation | 20 | 1440 | < th | dose dependent | rect. | 10 | 14 |
| 126 | 1360.71 | radiation | 20 | 1440 | < th | dose dependent | rect. | 10 | 9 |
| 129 | 1360.77 | radiation | 20 | 1440 | < th | dose dependent | rect. | 10 | 17 |
| 158 | 1362.76 | radiation | 1 | 1440 | > th | dose dependent | rect. | 13 | 5 |
| 171 | 1363.01 | radiation | 20 | 1440 | > th | dose independent | rect. | 7 | 10 |
| 185 | 1363.06 | radiation | 1 | 1440 | > th | dose dependent | sin | 16 | NA |
| 280 | 1363.23 | radiation | 20 | 1440 | > th | dose independent | sin | 21 | NA |
| 348 | 1365.87 | wind | 9 | 43200 | < th | dose independent | rect. | 15 | 2 |
| 435 | 1368.60 | radiation | 20 | 1440 | > th | dose independent | rect. | 11 | 6 |
| 658 | 1372.60 | radiation | 20 | 1440 | < th | dose dependent | rect. | 2 | 22 |
| 659 | 1372.62 | radiation | 20 | 1440 | < th | dose dependent | rect. | 2 | 17 |
| 661 | 1372.68 | radiation | 20 | 1440 | < th | dose dependent | rect. | 21 | 22 |
| 692 | 1372.90 | radiation | 20 | 1440 | < th | dose dependent | no | NA | NA |
| 699 | 1372.93 | radiation | 20 | 1440 | < th | dose dependent | rect. | 23 | 23 |
| 829 | 1376.59 | radiation | 20 | 1440 | < th | dose dependent | rect. | 16 | 23 |
| 889 | 1377.47 | wind | 9 | 43200 | > th | dose independent | rect. | 15 | 2 |