Os02g0741800
blastp(Os)/ blastp(At)/ coex/// RAP/ RiceXPro/ SALAD/ ATTED-II
Description : Similar to Permease 1.

FiT-DB / Search/ Help/ Sample detail
|
Os02g0741800 |
blastp(Os)/ blastp(At)/ coex/// RAP/ RiceXPro/ SALAD/ ATTED-II |
|
Description : Similar to Permease 1.
|
|
log2(Expression) ~ Norm(μ, σ2)
μ = α + β1D + β2C + β3E + β4D*C + β5D*E + γ1N8
|
_____ |
|

 __
__
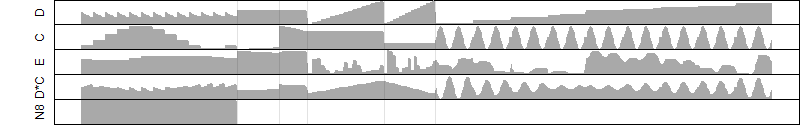
Dependence on each variable

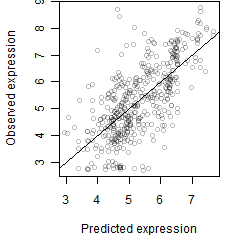
Residual plot

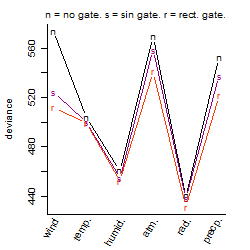
Process of the parameter reduction
(fixed parameters. wheather = radiation,
response mode = > th, dose dependency = dose dependent, type of G = no)
| deviance | σ | α | β1 | β2 | β3 | β4 | β5 | γ1 | peak time of C | threshold | memory length | peak or start time of G | open length of G |
|---|---|---|---|---|---|---|---|---|---|---|---|---|---|
| 428.19 | 0.972 | 5.7 | -2.79 | 0.00496 | 2.3 | -3.12 | -2.57 | -1.78 | 15.6 | -10.93 | 1349 | -- | -- |
| 439.94 | 0.977 | 5.66 | -2.48 | 0.00546 | 2.2 | -2.98 | -- | -1.66 | 16 | -113.2 | 1348 | -- | -- |
| 456.74 | 0.995 | 5.71 | -2.8 | 0.0297 | 2.3 | -- | -2.14 | -1.79 | 3.74 | -0.003778 | 1370 | -- | -- |
| 465.02 | 1 | 5.66 | -2.5 | 0.0509 | 2.22 | -- | -- | -1.7 | 12.5 | -342 | 1348 | -- | -- |
| 456.79 | 0.995 | 5.71 | -2.8 | -- | 2.31 | -- | -2.12 | -1.79 | -- | -0.05864 | 1370 | -- | -- |
| 615.61 | 1.16 | 5.54 | -2.11 | 0.273 | -- | 3.09 | -- | -1.13 | 3.29 | -- | -- | -- | -- |
| 643.43 | 1.19 | 5.56 | -2.17 | 0.345 | -- | -- | -- | -1.15 | 0.66 | -- | -- | -- | -- |
| 465.1 | 1 | 5.67 | -2.52 | -- | 2.23 | -- | -- | -1.68 | -- | -315.2 | 1349 | -- | -- |
| 629.05 | 1.17 | 5.59 | -- | 0.0556 | 1.97 | -- | -- | -1.34 | 11 | -144.9 | 1348 | -- | -- |
| 650.88 | 1.19 | 5.55 | -2.16 | -- | -- | -- | -- | -1.15 | -- | -- | -- | -- | -- |
| 767.73 | 1.3 | 5.5 | -- | 0.313 | -- | -- | -- | -0.91 | 0.33 | -- | -- | -- | -- |
| 629.23 | 1.17 | 5.6 | -- | -- | 1.95 | -- | -- | -1.34 | -- | -142.1 | 1348 | -- | -- |
| 773.88 | 1.3 | 5.5 | -- | -- | -- | -- | -- | -0.906 | -- | -- | -- | -- | -- |
Results of the grid search
Summarized heatmap of deviance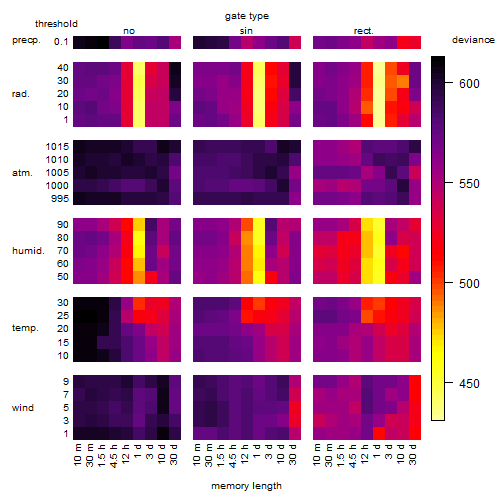
|
Histogram 
|
Local optima within top1000 grid-points
| rank | deviance | wheather | threshold | memory length | response mode | dose dependency | type of G | peak or start time of G | open length of G |
|---|---|---|---|---|---|---|---|---|---|
| 1 | 430.89 | radiation | 1 | 1440 | > th | dose dependent | rect. | 14 | 22 |
| 4 | 431.04 | radiation | 40 | 1440 | < th | dose dependent | rect. | 15 | 21 |
| 7 | 432.09 | radiation | 20 | 1440 | > th | dose independent | rect. | 15 | 21 |
| 46 | 438.36 | radiation | 10 | 1440 | > th | dose dependent | sin | 12 | NA |
| 55 | 439.33 | radiation | 1 | 1440 | > th | dose dependent | rect. | 6 | 11 |
| 57 | 439.40 | radiation | 20 | 1440 | > th | dose independent | rect. | 7 | 5 |
| 138 | 440.05 | radiation | 1 | 1440 | > th | dose dependent | no | NA | NA |
| 184 | 440.06 | radiation | 10 | 1440 | > th | dose dependent | sin | 5 | NA |
| 186 | 440.10 | radiation | 30 | 1440 | < th | dose independent | rect. | 14 | 21 |
| 195 | 440.66 | radiation | 10 | 1440 | > th | dose dependent | rect. | 7 | 5 |
| 209 | 440.73 | radiation | 20 | 1440 | > th | dose independent | sin | 6 | NA |
| 210 | 440.80 | radiation | 1 | 1440 | > th | dose dependent | sin | 2 | NA |
| 215 | 440.89 | radiation | 40 | 1440 | < th | dose dependent | rect. | 6 | 12 |
| 226 | 441.12 | radiation | 40 | 1440 | < th | dose dependent | rect. | 6 | 22 |
| 237 | 441.40 | radiation | 40 | 1440 | < th | dose dependent | rect. | 2 | 16 |
| 368 | 441.56 | radiation | 40 | 1440 | < th | dose dependent | rect. | 19 | 23 |
| 425 | 441.69 | radiation | 40 | 1440 | < th | dose dependent | no | NA | NA |
| 479 | 442.47 | radiation | 1 | 1440 | > th | dose dependent | rect. | 11 | 23 |
| 510 | 442.97 | radiation | 30 | 1440 | < th | dose independent | sin | 12 | NA |
| 516 | 443.15 | radiation | 40 | 1440 | < th | dose dependent | sin | 2 | NA |
| 531 | 443.55 | radiation | 40 | 1440 | < th | dose dependent | rect. | 11 | 23 |
| 727 | 444.59 | radiation | 40 | 1440 | < th | dose dependent | sin | 12 | NA |
| 969 | 446.14 | radiation | 20 | 1440 | > th | dose independent | rect. | 7 | 10 |
| 990 | 446.22 | radiation | 20 | 1440 | > th | dose independent | no | NA | NA |