Os02g0693400
blastp(Os)/ blastp(At)/ coex/// RAP/ RiceXPro/ SALAD/ ATTED-II
Description : Peptidase C19, ubiquitin carboxyl-terminal hydrolase 2 family protein.


FiT-DB / Search/ Help/ Sample detail
|
Os02g0693400 |
blastp(Os)/ blastp(At)/ coex/// RAP/ RiceXPro/ SALAD/ ATTED-II |
|
Description : Peptidase C19, ubiquitin carboxyl-terminal hydrolase 2 family protein.
|
|
log2(Expression) ~ Norm(μ, σ2)
μ = α + β1D + β2C + β3E + β4D*C + β5D*E + γ1N8
|
_____ |
|
 __
__
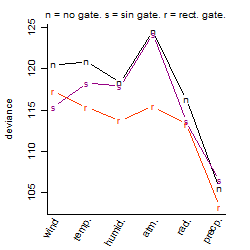
Dependence on each variable

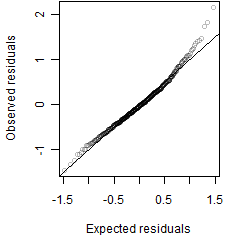
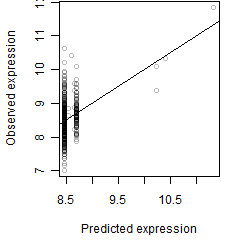
Residual plot

Process of the parameter reduction
(fixed parameters. wheather = precipitation,
response mode = > th, dose dependency = dose dependent, type of G = no)
| deviance | σ | α | β1 | β2 | β3 | β4 | β5 | γ1 | peak time of C | threshold | memory length | peak or start time of G | open length of G |
|---|---|---|---|---|---|---|---|---|---|---|---|---|---|
| 104.45 | 0.48 | 8.58 | -0.417 | 0.389 | 8.81 | 1.15 | -23.5 | 0.258 | 11.9 | 0.1403 | 295 | -- | -- |
| 127.23 | 0.529 | 8.5 | -0.00784 | 0.363 | 1.49 | 0.996 | -- | 0.208 | 12.8 | 0.1403 | 295 | -- | -- |
| 109.98 | 0.488 | 8.57 | -0.366 | 0.416 | 8.67 | -- | -23.2 | 0.253 | 11.4 | 0.1782 | 295 | -- | -- |
| 114.97 | 0.499 | 8.5 | -0.168 | 0.412 | 2.35 | -- | -- | 0.228 | 11.4 | 0.2168 | 299 | -- | -- |
| 118.15 | 0.506 | 8.57 | -0.334 | -- | 9.71 | -- | -26.8 | 0.24 | -- | 0.09404 | 173 | -- | -- |
| 129.61 | 0.534 | 8.5 | 0.0134 | 0.354 | -- | 0.934 | -- | 0.204 | 12.6 | -- | -- | -- | -- |
| 132.99 | 0.54 | 8.49 | 0.0466 | 0.359 | -- | -- | -- | 0.207 | 11.8 | -- | -- | -- | -- |
| 123.4 | 0.517 | 8.49 | -0.0932 | -- | 2.78 | -- | -- | 0.217 | -- | 1.189 | 176 | -- | -- |
| 115.09 | 0.5 | 8.49 | -- | 0.421 | 2.37 | -- | -- | 0.226 | 11.3 | 0.3114 | 299 | -- | -- |
| 141.07 | 0.555 | 8.5 | 0.0362 | -- | -- | -- | -- | 0.203 | -- | -- | -- | -- | -- |
| 133.04 | 0.54 | 8.49 | -- | 0.358 | -- | -- | -- | 0.202 | 11.8 | -- | -- | -- | -- |
| 123.15 | 0.517 | 8.49 | -- | -- | 2.85 | -- | -- | 0.225 | -- | 1.37 | 176 | -- | -- |
| 141.11 | 0.554 | 8.5 | -- | -- | -- | -- | -- | 0.199 | -- | -- | -- | -- | -- |
Results of the grid search
Summarized heatmap of deviance
|
Histogram 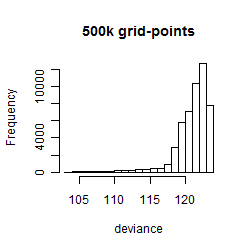
|
Local optima within top1000 grid-points
| rank | deviance | wheather | threshold | memory length | response mode | dose dependency | type of G | peak or start time of G | open length of G |
|---|---|---|---|---|---|---|---|---|---|
| 1 | 103.22 | precipitation | 0.1 | 270 | > th | dose dependent | rect. | 20 | 23 |
| 4 | 103.47 | precipitation | 0.1 | 270 | > th | dose dependent | rect. | 2 | 17 |
| 10 | 104.17 | precipitation | 0.1 | 270 | > th | dose dependent | rect. | 16 | 19 |
| 20 | 104.73 | precipitation | 0.1 | 270 | > th | dose independent | rect. | 21 | 22 |
| 26 | 104.90 | precipitation | 0.1 | 270 | > th | dose independent | rect. | 16 | 19 |
| 33 | 104.93 | precipitation | 0.1 | 270 | > th | dose independent | rect. | 2 | 17 |
| 63 | 105.40 | precipitation | 0.1 | 270 | > th | dose dependent | rect. | 5 | 23 |
| 69 | 105.46 | precipitation | 0.1 | 270 | > th | dose dependent | no | NA | NA |
| 74 | 105.48 | precipitation | 0.1 | 270 | > th | dose dependent | rect. | 9 | 23 |
| 80 | 105.62 | precipitation | 0.1 | 270 | > th | dose independent | rect. | 16 | 12 |
| 81 | 105.62 | precipitation | 0.1 | 270 | > th | dose independent | rect. | 5 | 23 |
| 126 | 106.18 | precipitation | 0.1 | 270 | > th | dose dependent | rect. | 16 | 13 |
| 135 | 106.35 | precipitation | 0.1 | 270 | > th | dose independent | rect. | 2 | 22 |
| 145 | 106.46 | precipitation | 0.1 | 270 | > th | dose dependent | sin | 1 | NA |
| 154 | 106.54 | precipitation | 0.1 | 270 | > th | dose independent | no | NA | NA |
| 155 | 106.54 | precipitation | 0.1 | 270 | < th | dose independent | no | NA | NA |
| 159 | 106.54 | precipitation | 0.1 | 270 | < th | dose dependent | no | NA | NA |
| 195 | 106.88 | precipitation | 0.1 | 270 | > th | dose independent | rect. | 16 | 3 |
| 240 | 107.41 | precipitation | 0.1 | 270 | > th | dose dependent | rect. | 14 | 5 |
| 241 | 107.44 | precipitation | 0.1 | 270 | > th | dose dependent | rect. | 16 | 3 |
| 279 | 108.03 | precipitation | 0.1 | 270 | < th | dose independent | sin | 1 | NA |
| 280 | 108.03 | precipitation | 0.1 | 270 | < th | dose dependent | sin | 1 | NA |
| 287 | 108.21 | precipitation | 0.1 | 270 | > th | dose independent | sin | 0 | NA |
| 327 | 108.65 | precipitation | 0.1 | 270 | < th | dose independent | sin | 14 | NA |
| 329 | 108.65 | precipitation | 0.1 | 270 | < th | dose dependent | sin | 14 | NA |
| 351 | 109.14 | precipitation | 0.1 | 270 | > th | dose dependent | sin | 13 | NA |
| 352 | 109.20 | precipitation | 0.1 | 270 | > th | dose independent | sin | 14 | NA |
| 727 | 111.43 | precipitation | 0.1 | 270 | > th | dose independent | rect. | 16 | 8 |