Os02g0666500
blastp(Os)/ blastp(At)/ coex/// RAP/ RiceXPro/ SALAD/ ATTED-II
Description : Similar to Cytochrome P450.


FiT-DB / Search/ Help/ Sample detail
|
Os02g0666500 |
blastp(Os)/ blastp(At)/ coex/// RAP/ RiceXPro/ SALAD/ ATTED-II |
|
Description : Similar to Cytochrome P450.
|
|
log2(Expression) ~ Norm(μ, σ2)
μ = α + β1D + β2C + β3E + β4D*C + β5D*E + γ1N8
|
_____ |
|

 __
__
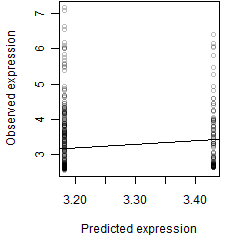
Dependence on each variable

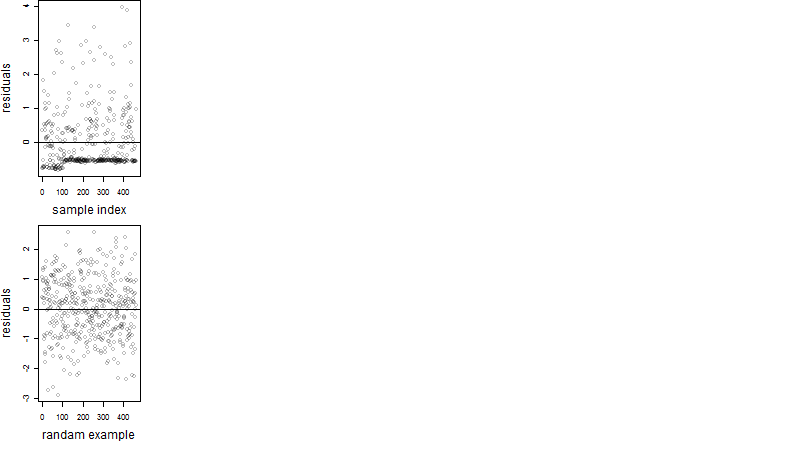
Residual plot
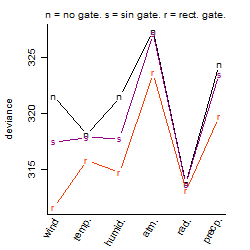
Process of the parameter reduction
(fixed parameters. wheather = temperature,
response mode = > th, dose dependency = dose independent, type of G = no)
| deviance | σ | α | β1 | β2 | β3 | β4 | β5 | γ1 | peak time of C | threshold | memory length | peak or start time of G | open length of G |
|---|---|---|---|---|---|---|---|---|---|---|---|---|---|
| 321.08 | 0.842 | 3.26 | -0.38 | 0.543 | 0.369 | -1.52 | -2.18 | -0.0431 | 5.31 | 25.74 | 59 | -- | -- |
| 334.08 | 0.858 | 3.19 | 0.194 | 0.492 | 0.241 | -0.688 | -- | 0.192 | 5.46 | 25.74 | 59 | -- | -- |
| 325.98 | 0.841 | 3.24 | -0.262 | 0.538 | 0.357 | -- | -1.7 | 0.000929 | 5.51 | 25.72 | 53 | -- | -- |
| 335.19 | 0.858 | 3.19 | 0.186 | 0.502 | 0.262 | -- | -- | 0.189 | 5.2 | 25.74 | 59 | -- | -- |
| 335.49 | 0.858 | 3.22 | -0.129 | -- | 0.16 | -- | -1.64 | 0.143 | -- | 26.39 | 23 | -- | -- |
| 337.9 | 0.862 | 3.17 | 0.265 | 0.352 | -- | -0.798 | -- | 0.267 | 6.58 | -- | -- | -- | -- |
| 339.5 | 0.863 | 3.17 | 0.253 | 0.348 | -- | -- | -- | 0.269 | 6.68 | -- | -- | -- | -- |
| 341.47 | 0.861 | 3.18 | 0.307 | -- | -0.589 | -- | -- | 0.262 | -- | 33.01 | 180 | -- | -- |
| 336.08 | 0.858 | 3.19 | -- | 0.519 | 0.282 | -- | -- | 0.163 | 5.12 | 25.8 | 28 | -- | -- |
| 345.83 | 0.869 | 3.18 | 0.261 | -- | -- | -- | -- | 0.276 | -- | -- | -- | -- | -- |
| 341.19 | 0.864 | 3.18 | -- | 0.351 | -- | -- | -- | 0.241 | 6.63 | -- | -- | -- | -- |
| 343.75 | 0.864 | 3.19 | -- | -- | -0.512 | -- | -- | 0.216 | -- | 33.03 | 326 | -- | -- |
| 347.63 | 0.87 | 3.18 | -- | -- | -- | -- | -- | 0.247 | -- | -- | -- | -- | -- |
Results of the grid search
Summarized heatmap of deviance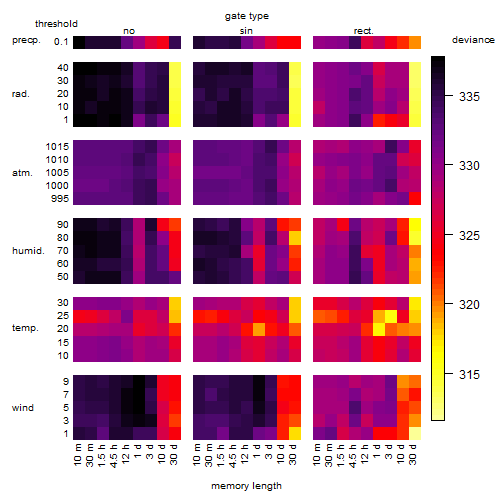
|
Histogram 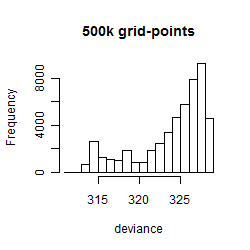
|
Local optima within top1000 grid-points
| rank | deviance | wheather | threshold | memory length | response mode | dose dependency | type of G | peak or start time of G | open length of G |
|---|---|---|---|---|---|---|---|---|---|
| 1 | 311.59 | wind | 1 | 43200 | < th | dose dependent | rect. | 23 | 3 |
| 3 | 313.09 | radiation | 30 | 43200 | > th | dose independent | rect. | 11 | 1 |
| 6 | 313.22 | radiation | 40 | 43200 | < th | dose independent | rect. | 11 | 1 |
| 8 | 313.32 | radiation | 40 | 43200 | < th | dose independent | rect. | 10 | 5 |
| 11 | 313.35 | radiation | 40 | 43200 | < th | dose independent | rect. | 13 | 2 |
| 13 | 313.38 | radiation | 30 | 43200 | > th | dose dependent | rect. | 11 | 1 |
| 17 | 313.45 | radiation | 30 | 43200 | < th | dose independent | rect. | 8 | 5 |
| 25 | 313.48 | radiation | 40 | 43200 | < th | dose independent | rect. | 10 | 16 |
| 26 | 313.48 | radiation | 40 | 43200 | < th | dose independent | rect. | 10 | 20 |
| 120 | 313.63 | radiation | 30 | 43200 | < th | dose independent | sin | 2 | NA |
| 125 | 313.63 | radiation | 30 | 43200 | < th | dose independent | rect. | 8 | 13 |
| 132 | 313.63 | radiation | 30 | 43200 | < th | dose independent | rect. | 8 | 22 |
| 142 | 313.65 | radiation | 10 | 43200 | > th | dose independent | rect. | 9 | 1 |
| 216 | 313.72 | radiation | 30 | 43200 | < th | dose independent | no | NA | NA |
| 325 | 313.74 | radiation | 40 | 43200 | < th | dose independent | sin | 19 | NA |
| 352 | 313.77 | radiation | 30 | 43200 | < th | dose independent | rect. | 13 | 23 |
| 402 | 313.80 | radiation | 30 | 43200 | > th | dose dependent | rect. | 10 | 5 |
| 403 | 313.81 | radiation | 20 | 43200 | < th | dose independent | rect. | 14 | 2 |
| 444 | 313.89 | radiation | 30 | 43200 | > th | dose independent | rect. | 8 | 4 |
| 695 | 314.00 | radiation | 20 | 43200 | > th | dose dependent | rect. | 14 | 23 |
| 742 | 314.04 | radiation | 30 | 43200 | > th | dose dependent | sin | 22 | NA |
| 784 | 314.06 | radiation | 40 | 43200 | > th | dose independent | rect. | 14 | 22 |
| 924 | 314.09 | radiation | 30 | 43200 | > th | dose dependent | no | NA | NA |